As I thought. For a more realistic interpretation of the data, look here:
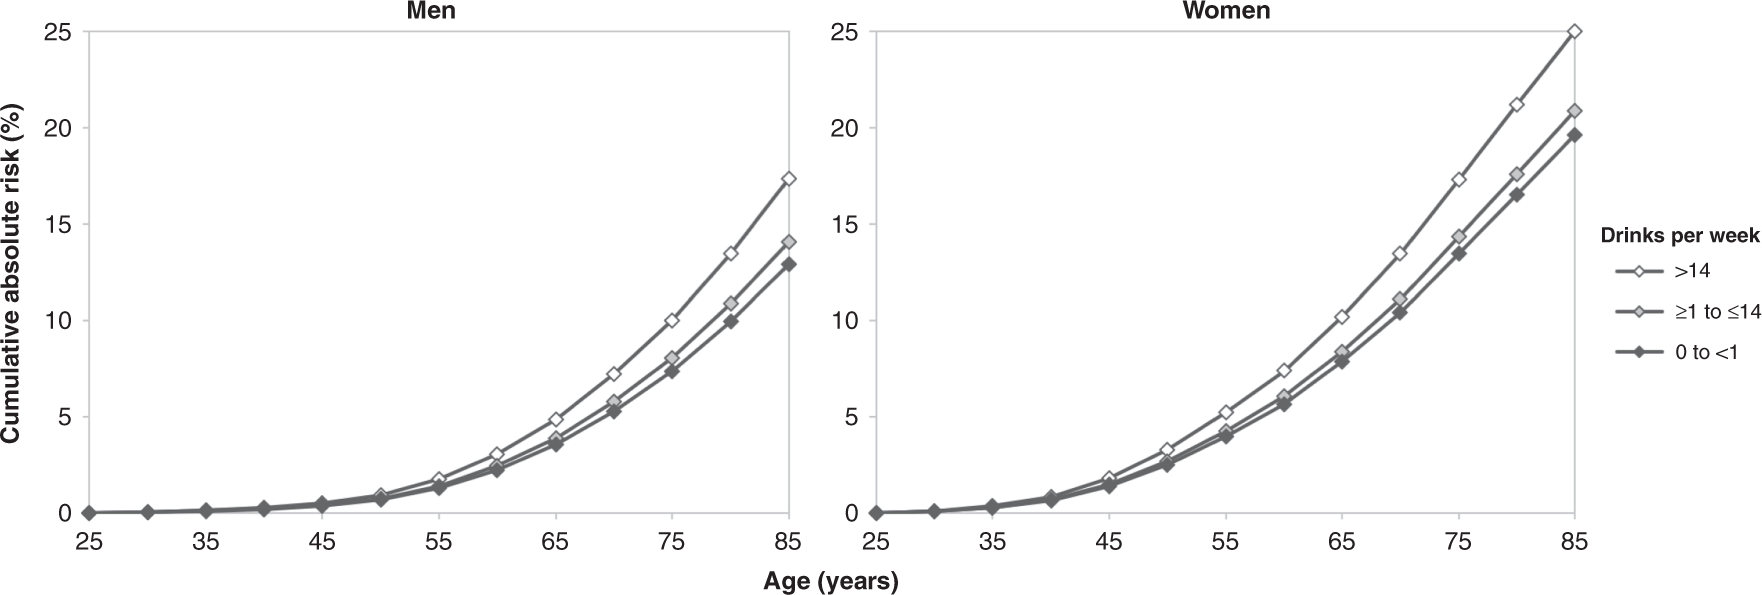
I think the following graphs showing cumulative absolute risk give a better representation of these risks than anything I’ve seen in the press.
Risk increases with age, even among the non-drinkers (bottom curves, 0 to <1 drink per week). It’s greater than 10% of male non-drinkers and 15% of female non-drinkers by age 85, a reminder that alcohol is not the only cause of cancer in these alcohol-related cancers.
The heaviest drinkers (>14 drinks/week, median 21/wk for men, 20/wk for women), represented by the top curves had an absolute increase in risk of developing an alcohol-related cancer of about 1% for men and 2% for women by age 65. That increased to about 3% (men) and 4% (women) by age 75 and about 4% (men) and 5-6% (women) by age 85.
In table form, simplified and rounding to the nearest percentage, I look at it like this:
Approximate Increase in Absolute Risk
(median 20-21 drinks/week vs. <1 drink/week)
Age….…Men………Women
45………<1%………<1%
55………<1%………~1%
65………~1%………~2%
75………~3%………~4%
85………~4%………~6%