Year-End Wines Consumed Stats

My annual review. These include only bottles I pulled from my cellar. In parentheses is last year then 2020. All using CT categories and data.

Interesting that most frequent vintage drunk actually got OLDER this year as 2010 knocked off 2015 after it had that title for three years in a row.

Somehow I managed not to open any 2000s and also no 2021s (first time I can remember opening nothing from the vintage prior to the calendar year) so this was a pretty poor streak of consecutive vintages tasted, coming off my best-ever last year. One bottle of 2000 would have given me another streak back to 1991 this year.

I’m surprised that whites dropped and reds increased this year. I expect that to be an anomaly. Also that France dropped below 50% for the first time ever. Will that be a trend? Maybe, but I don’t see France ever going below 40. Ditto for USA edging out Italy for number 2 - I expect Italy to be there more often, but maybe they’ll swap places from time to time. Likewise for California taking the number 1 region over Rhône even though Rhône consumption went up by a percentage point. I think the Ravenswood library sales impacted these numbers (and obviously the new number 1 producer figure) and will continue to do so for 2-3 more years as I drink those purchases.

Bottles consumed - 224 (245, 240)

Type
Red 87.5% (82, 81)
White 10% (15, 14)
Rosé 2.5% (3, 1)

Oldest 1974 (1978. 1976)
Most frequent vintage 2010 11% (2015, 2015)
Second most frequent vintage 2015 9% (2016, 2010)

Total number of vintages excluding NV 35 (38, 34)
At least one bottle every vintage from 2020 back to: 2001 (1991-2020, 2000-2019)

Most frequent “master variety” Red Rhône Blend 12.5% (Red Bdx Blend, Red Bdx Blend)
Second most - Syrah 12% (Red RhĂ´ne Blend, Syrah)
Total number of “master varieties” 37 (39, 45)

Most frequent producer Ravenswood 2.7% (tie Grand Nicolet and Ca’ Rozzeria, Ca’ Rozzeria)
Second most - Bedrock 2% (tie mentioned above, Turley)

Most frequent country - France 45% (France 56, France 52)
Second most - USA 22% (Italy 20, Italy 20)
Total number of countries - 9 (9, 9)

Most frequent region - California 22% (RhĂ´ne 19, RhĂ´ne 19)
Second most - RhĂ´ne 21% (Bordeaux 16, Bordeaux 14)
Total number of regions 29 (34, 34)

Most frequent sub-region (other than “blank”) - Southern Rhône 12.5% (Southern Rhône 14, Southern Rhône 12)
Second most - Napa Valley 8% (Chianti 9, Chianti 8)
Total number of sub-regions 35 (30, 31)

Most frequent appellation (other than “blank”) - Chianti Classico 6% (Chianti Classico 8, Chianti Classico 8)
Second most - CĂ´tes du RhĂ´ne/Napa Valley tie 5% (CdP 4, CdP 4)
Total number of appellations 98 (107, 112)

Percentage of total value represented by 10 most valuable bottles - 29.7%

1 Like

On the advice of counsel I refuse to answer.

1 Like

My annual review. These include only bottles I pulled from my cellar. In parentheses after each data point is last year then 2021. All using CT categories and data.

2015 reclaims the “vintage most frequently drunk” title it held for three years before losing out to 2010 last year, and did so convincingly with a shockingly high 15% of all bottles consumed, almost triple any other single vintage. At some point I have to start running low on 2015s, right?

I set my all-time record for “at least one bottle from every vintage going back to ____” with every vintage from 2022 back to 1988 represented.

I said last year that I expected the drop in whites and increase in reds to be an anomaly and that proved true, as 2023 numbers there looked more like 2021. France returned to over 50% after its first-ever drop below 50% last year, but barely. USA maintained the silver-medal spot it claimed from Italy last year, but Italy was only 3 bottles behind.

Countries were very unevenly distributed - Portugal and Lebanon were in 6th and 7th spots, and Germany in 5th had more than both of them combined, and Spain in 4th had more than Germany, Portugal, and Lebanon combined, and Italy in 3rd had more than Spain, Germany, Portugal, and Lebanon combined. France, USA, and Italy combined for 87.5% of all bottles consumed.

Bottles consumed - 224 (224, 245)

Type
Red 82% (87.5, 82)
White 14% (10, 15)
Rosé 4.5% (2.5, 3)

Oldest 1970 (1974, 1978)
Most frequent vintage 2015 15% (2010, 2015)
Second most frequent vintage Tie 2005, 2009, 2010, 2014, each at 5% (2015, 2016)

Total number of vintages excluding NV 40 (35, 38)
At least one bottle every vintage from 2020 back to: 1988! (2001, 1991)

Most frequent “master variety” Red Bdx Blend, 11.6% (Red Rhône Blend, Red Bdx Blend)
Second most - Red RhĂ´ne Blend 11.2% (Syrah, Red RhĂ´ne Blend)
Total number of “master varieties” 39 (37, 39)

Most frequent producer Tie Bedrock and Ravenswood 2.7% each (Ravenswood, tie Grand Nicolet and Ca’ Rozzeria)
Second most - tie mentioned above (Bedrock, tie mentioned above)
Total producers - 153

Most frequent country - France 50.4% (France 45, France 56)
Second most - USA 19.2% (USA 22, Italy 20)
Total number of countries - 7 (9, 9)

Most frequent region - RhĂ´ne 19.6% (California 22, RhĂ´ne 19)
Second most - California 18% (RhĂ´ne 21, Bordeaux 16)
Total number of regions 29 (29, 34)

Most frequent sub-region (other than “blank”) - Southern Rhône 11.6% (Southern Rhône 12.5, Southern Rhône 14)
Second most - Northern RhĂ´ne 8% (Napa Valley 8, Chianti 9)
Total number of sub-regions 29 (35, 30)

Most frequent appellation (other than “blank”) - Chianti Classico 6% (Chianti Classico 6, Chianti Classico 8)
Second most - Châteauneuf du Pape 5.8% (Côtes du Rhône/Napa Valley tie 5, CdP 4)
Total number of appellations 102 (98, 107)

Percentage of total “value” represented by the 10 most “valuable” bottles - 30.2% (29.7)

2 Likes

It’s fun to look back in this way. I consumed 238 bottles:

Red 63.9%
White 32.8%
Rose 2.9%
Orange 0.4%

Oldest: 1989
Most frequent vintage: 2020 19.7%
Second-most: 2021 14.7%

“Master variety”: Syrah 23.9%
Second-most: Riesling 10.1%
Total varieties: 33

Top producer: Clos du Gravillas 9.2%
No. 2: Paitin di Pasquero-Elia 5.0%
Total producers: 89

Top country: France 68.1%
No. 2: Spain 10.9%
Total countries: 8

Top region: Rhone 21.8%
No. 2: Languedoc-Roussillon 16.4%
Total regions: 28

Top sub-region: Northern Rhone 20.2%
No. 2: Roussillon 8.4%
Total sub-regions (other than “blank”): 21

Top appellation: CĂ´tes Catalanes 7.6%
No. 2: Mosel-Saar-Ruwer 7.1%
Total appellations: 61

Percentage of total “value” represented by the 10 most “valuable” bottles: 18%

It’s that time of year again, time to look back at the year that was and let CT crunch some numbers for me - These include only bottles I pulled from my cellar in 2024. In parentheses after each data point is 2023 then 2022. All using CT categories and data.

Observations -

For the first time since I’ve been doing this, the oldest vintage is from the '80s rather than the '70s. Time marches on.

Also for the first time, I broke 40 on “master varieties” opened and broke 10 on countries and 35 on regions (thanks to that Austrian riesling we had on New Year’s Eve!)

134 producers were represented by one bottle each, accounting for more than half of the total bottles opened. And only 15 producers saw more than 2 bottles opened. Variety is the spice of life!

(Yet despite all this variety, 8 different wines (exact same including vintage) were each opened 3 separate times during the year - one of these is my 'house pour" tawny port, one is our favorite rosé (Lulu) the others were all daily drinkers where I got a case purchase deal, whereas I normally don’t buy that many of any one vintage of any one wine).

2015 has been the “vintage most frequently drunk” for 5 of the last 6 years. When will it finally be overtaken for good?

The increase in white wine consumption continues and exceeded 15% for the first time.

Countries continue to be very unevenly distributed - France in first has more than the next two (USA and Italy) combined. USA and Italy were actually close, but Italy in third has more than 4th-10th (Spain, Germany, Portugal, Australia, Argentina, Austria, Switzerland) combined. Portugal in 6th also has more than 7th-10th combined. No Lebanon this year, which is rare. Otherwise I’d have had 11 countries!

The stats -

Bottles consumed - 242 (224, 224)

Type
Red 81% (82, 87.5)
White 16.5% (14, 10)
Rosé 2.5% (4.5, 2.5)

Oldest 1984 (1970, 1974)
Most frequent vintage 2015 15% (2015, 2010)
Second most frequent vintage 2016 (Tie 2005, 2009, 2010, 2014; 2015)

Total number of vintages excluding NV 37 (40, 35)
At least one bottle every vintage from 2023 back to: 2001 (1988, 2001)

Most frequent “master variety” Syrah 13.2 % (Red Bdx Blend, Red Rhône Blend)
Second most - Red Bordeaux Blend 12.4% (Red RhĂ´ne Blend, Syrah)
Total number of “master varieties” 42 (39, 37)

Most frequent producer Bedrock 3.3% (Tie Bedrock and Ravenswood, Ravenswood)
Second most - Vincent Paris 2.1% (tie mentioned above, Bedrock)
Total producers - 174 (153)

Most frequent country - France 45% (France 50, France 45)
Second most - USA 21.5% (USA 19, USA 22)
Total number of countries - 10 (7, 9)

Most frequent region - California 20.7% (RhĂ´ne 19.6, California 22)
Second most - RhĂ´ne 17.8% (California 18, RhĂ´ne 21)
Total number of regions 35 (29, 29)

Most frequent sub-region (other than “blank”) - Northern Rhône 11.2% (Southern Rhône 11.6, Southern Rhône 12.5)
Second most - Sonoma County 10.3% (Northern RhĂ´ne 8, Napa Valley 8)
Total number of sub-regions 30 (29, 35)

Most frequent appellation (other than “blank”) - Chianti Classico 5% (Chianti Classico 6, Chianti Classico 6)
Second most - Crozes-Hermitage 4.1% (Châteauneuf du Pape 5.8%, Côtes du Rhône/Napa Valley tie 5)
Total number of appellations 100 (102, 98)

Percentage of total “value” represented by the 10 most “valuable” bottles - 24.3% (30.2, 29.7)

1 Like

That’s pretty cool to see.

I’m at 50% france, which is a little surprising, but then I remember where champagne is :man_shrugging:

1 Like

A little late this year, but it’s time once again to look back at the year that was and let CT crunch some numbers for me - These include only bottles I pulled from my cellar in 2025. In parentheses after each data point is 2024 then 2023. All using CT categories and data.

Observations -

Bottles consumed was within 1 of 2023 and 2022, indicating that 2024 at almost 2 cases higher was an outlier.

Last year, for the first time since I’ve been doing this, the oldest vintage was from the '80s rather than the '70s, but the '70s are back this year! And if things hold to plan we’ll dip into the '60s next year!

Number of “master varieties” was back down to 38 after breaking 40 last year but included Bobal and Telti-Kuruk, both of which I think were new to the list, the latter for sure.

2015 has now been the “vintage most frequently drunk” for 6 of the last 7 years and even increased its share this year. When will it finally be overtaken for good? 2015 and 2016 together accounted for almost 30% of all bottles opened. I think this is in large part a function of those vintages being widely available when I extensively bought upgraded daily drinkers during the great WDC coupon-pa-looza.

After a few years of red wine decreasing and white and rosé increasing (and peaking a couple of years ago), these percentages seem to have stabilized at roughly 82/16/2. Each of those includes the sub-types like sweet white, sparkling white, fortified red, etc.

Countries continue to be very unevenly distributed - France in first has more than the next two (USA and Italy) combined. USA in second has barely less than the next two (Italy and Spain) combined, and Italy in third has more than the next two (Spain and Germany) combined, but this is less uneven than last year when Italy had more than all remaining countries (4th-10th) combined.

The stats -

Bottles consumed - 223 (242, 224)

Color
Red 82% (81, 82)
White 16% (16.5, 14)
Rosé 1.8% (2.5, 4.5)

Oldest 1978 (1984, 1970)
Most frequent vintage 2015 16.6% (2015, 2015)
Second most frequent vintage 2016 (2016, Tie 2005/2009/2010/2014)

Total number of vintages excluding NV 39 (37, 40)
At least one bottle every vintage from 2023* back to: 1988 (2001, 1988)

(*) This is the first time since I’ve been doing this that the youngest vintage drunk wasn’t the year before the calendar year in question. That wine is always Lulu, but this year I managed not to open any of my 2024 Lulu, drinking 2023s and a couple of other aging rosés I had laying around instead.

Most frequent “master variety” - Red Rhône Blend 12.1% (Syrah, Red Bdx Blend)
Second most - Syrah 11.2% (Red Bordeaux Blend, Red RhĂ´ne Blend)
Third most - Tie Red Bordeaux Blend/ Sangiovese 9.4%
Total number of “master varieties” 38 (42, 39)

Most frequent producer Bedrock 3.1% (Bedrock, Tie Bedrock and Ravenswood)
Second most - Beaucastel 2.7% (Vincent Paris, Tie mentioned above)
Total producers - 163 (174, 153)

Producers with only one bottle opened 131 (134)
Producers with more than 2 bottles opened 16 (15)
Variety is the spice of life!

Most frequent country - France 45% (France 45, France 50)
Second most - USA 22.4% (USA 21.5, USA 19)
Third most - Italy 15.2%
Total number of countries - 8 (10, 7)

Most frequent region - California 22.4% (California 20.7, RhĂ´ne 19.6)
Second most - RhĂ´ne 21.5% (RhĂ´ne 17.8, California 18)
Third most - Tuscany 9.9%
Total number of regions 30 (35, 29)

Most frequent sub-region (other than “blank”) - Southern Rhône 13% (Northern Rhône 11.2, Southern Rhône 11.6)
Second most - Sonoma County 9 % (Sonoma County 10.3, Northern RhĂ´ne 8)
Third most - Northern RhĂ´ne 8.5%
Total number of sub-regions 27 (30, 29)

Most frequent appellation (other than “blank”) - Châteauneuf du Pape 5.8% (Chianti Classico 5, Chianti Classico 6)
Second most - Chianti Classico 4.5% (Crozes-Hermitage 4.1, Châteauneuf du Pape 5.8)
Third most - Sonoma Valley 3.6%
Total number of appellations 93 (100, 102)

Percentage of total “value” represented by the 10 most “valuable” bottles - 23.4% (24.3, 30.2)

Can someone check to see if this even qualifies for Berserker status?? :laughing:

We did 51% white, 33% red and 16% rosé spread out over 42 vintages. We did 35% France, 30% Italy, 19% USA, 7% Spain, 4% Austria, 3% Germany, and had 84 different master varieties.

As long as I stay above the Mendoza line, I’m counting it! :flexed_biceps:

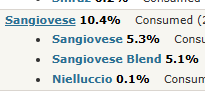
You are either counting at what CT labels as the “variety” level rather than the “master variety” level, or dang, MMW, you get around!

E.g., in the snip below, the wines described count as only one “master variety” (sangiovese) but as three “varieties,” under the CT nomenclature.

image

299 for 2025. Slight uptick over 2024’s 288.

Nope, the “variety” count is 103. I do drink a wide variety of wines from all over.

1 Like