Hi all – I’m a grad student at UIUC working with the economics department on a paper about the 2020 Glass Fire and its impact on California red grape pricing and production.
Below are seven descriptive figures using California Grape Crush data (2015–2024) for Pinot Noir, Cabernet Sauvignon, and Merlot. Districts are grouped into Control / Low / Medium / High exposure tiers based on 2020 smoke impact. These are descriptive, not causal, and shown alongside broader market context via the Liv-ex 100.
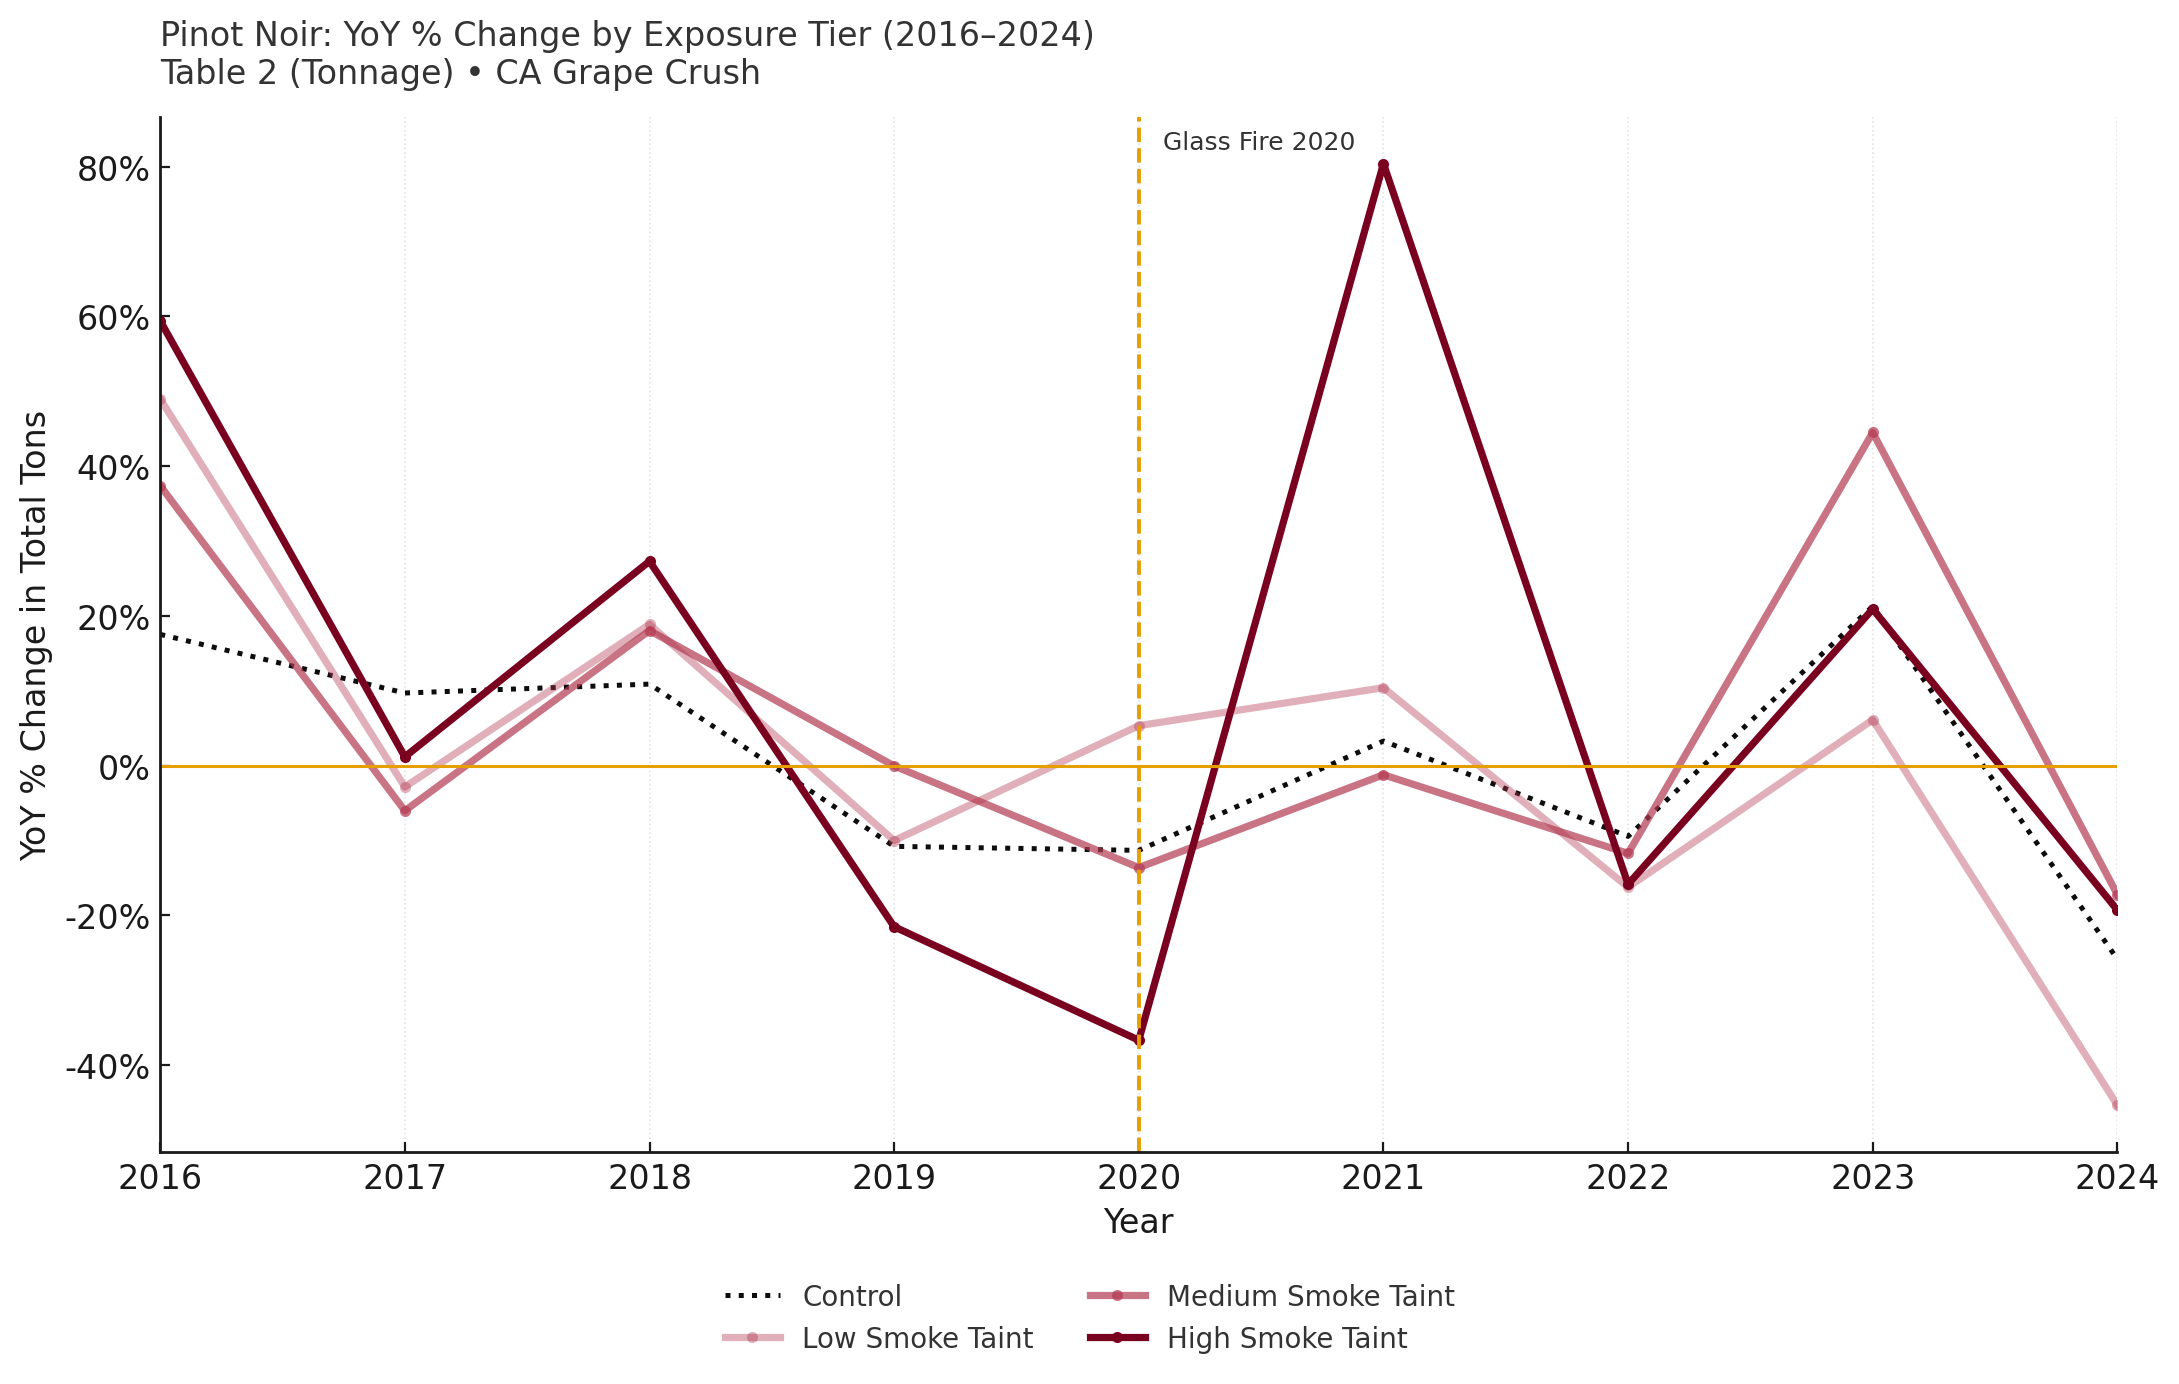
Supply: For all three reds, tonnage contracts sharply in 2020, especially in higher-exposure districts, consistent with smoke-taint-related non-harvests and discounting.
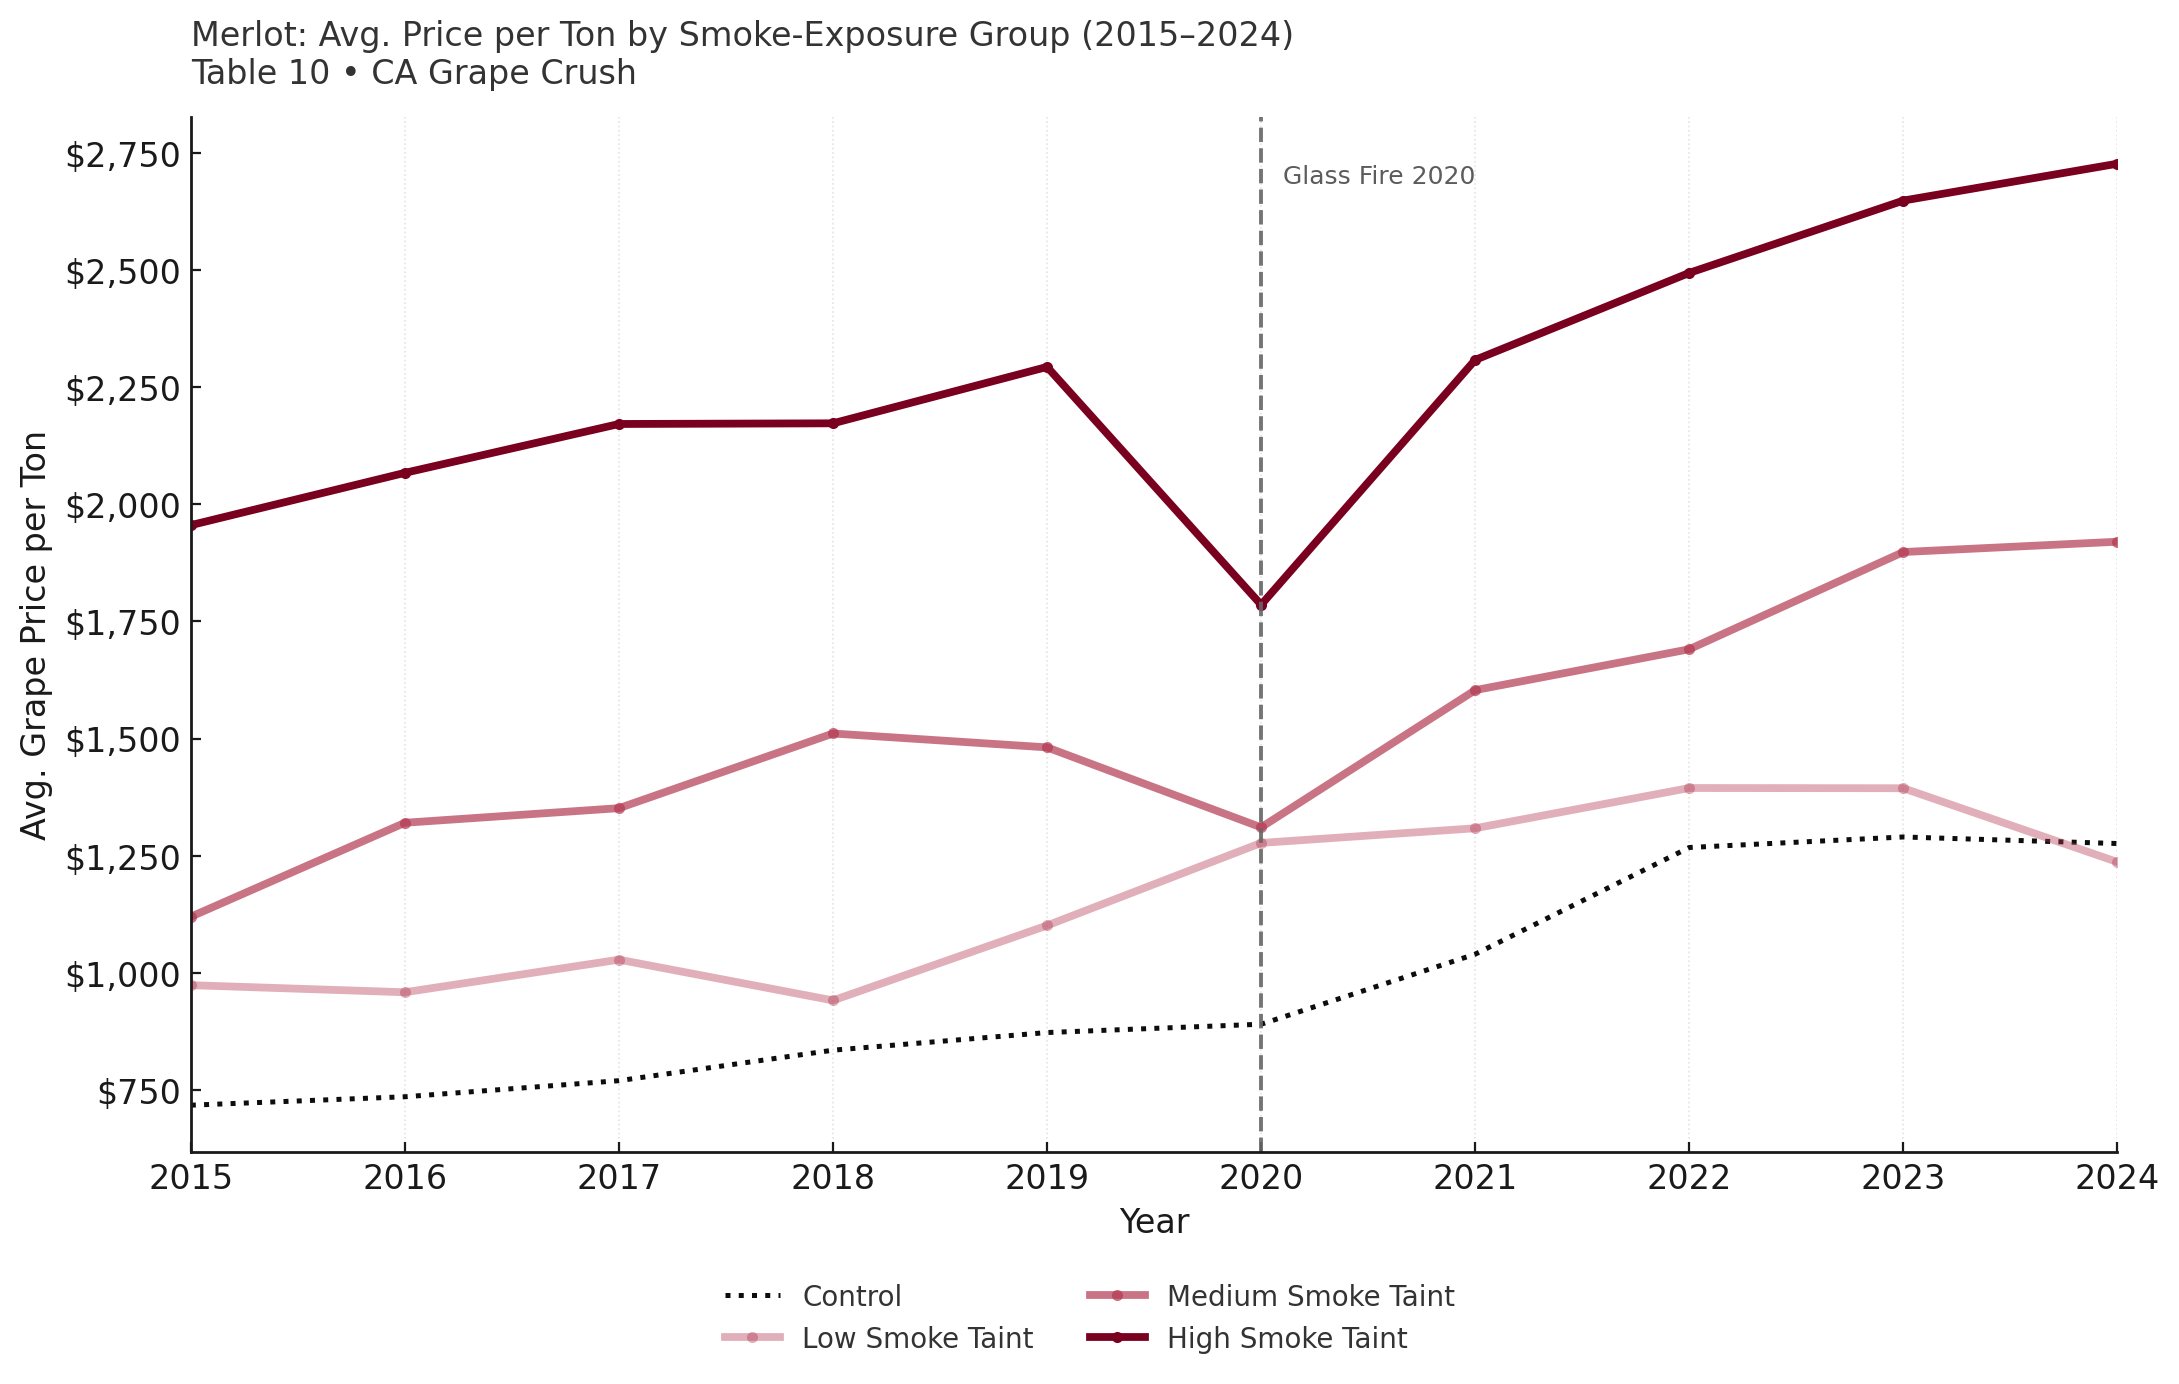
Prices:High-exposure tiers show clear level shifts around 2020–2021 versus lower-exposure and control areas, with partial recovery afterward.
What I’m looking for:
I’m hoping to find a Liv-ex California index time series (monthly or quarterly, 2015–2024) to better link upstream grape pricing to finished-wine market trends. I already have the Liv-ex 100 via Bloomberg, but a California-focused index would allow for a cleaner connection to regional price dynamics.
Any leads or references to additional finished-wine price data sources would be greatly appreciated.
Please feel free to reach out here on the forum or by email at kylec7@illinois.edu.
– Kyle Cribbins
University of Illinois Urbana-Champaign
I don’t think the liv-ex indices are what you are looking for - the indices are comprised of specific bottles from specific vintages and, without the weights, you wouldn’t be able to tease apart which bottles are driving the index. Acker does supply wine indices for free and gives some reasonable data - might want to try them.
If I were you, I would construct my own index for a representative set of bottles. If you goal is secondary market action, using data from WineMarketJournal and Acker you could do this fairly easily. If you want primary market data, I think you want list prices which you can get essentially through wine-searcher
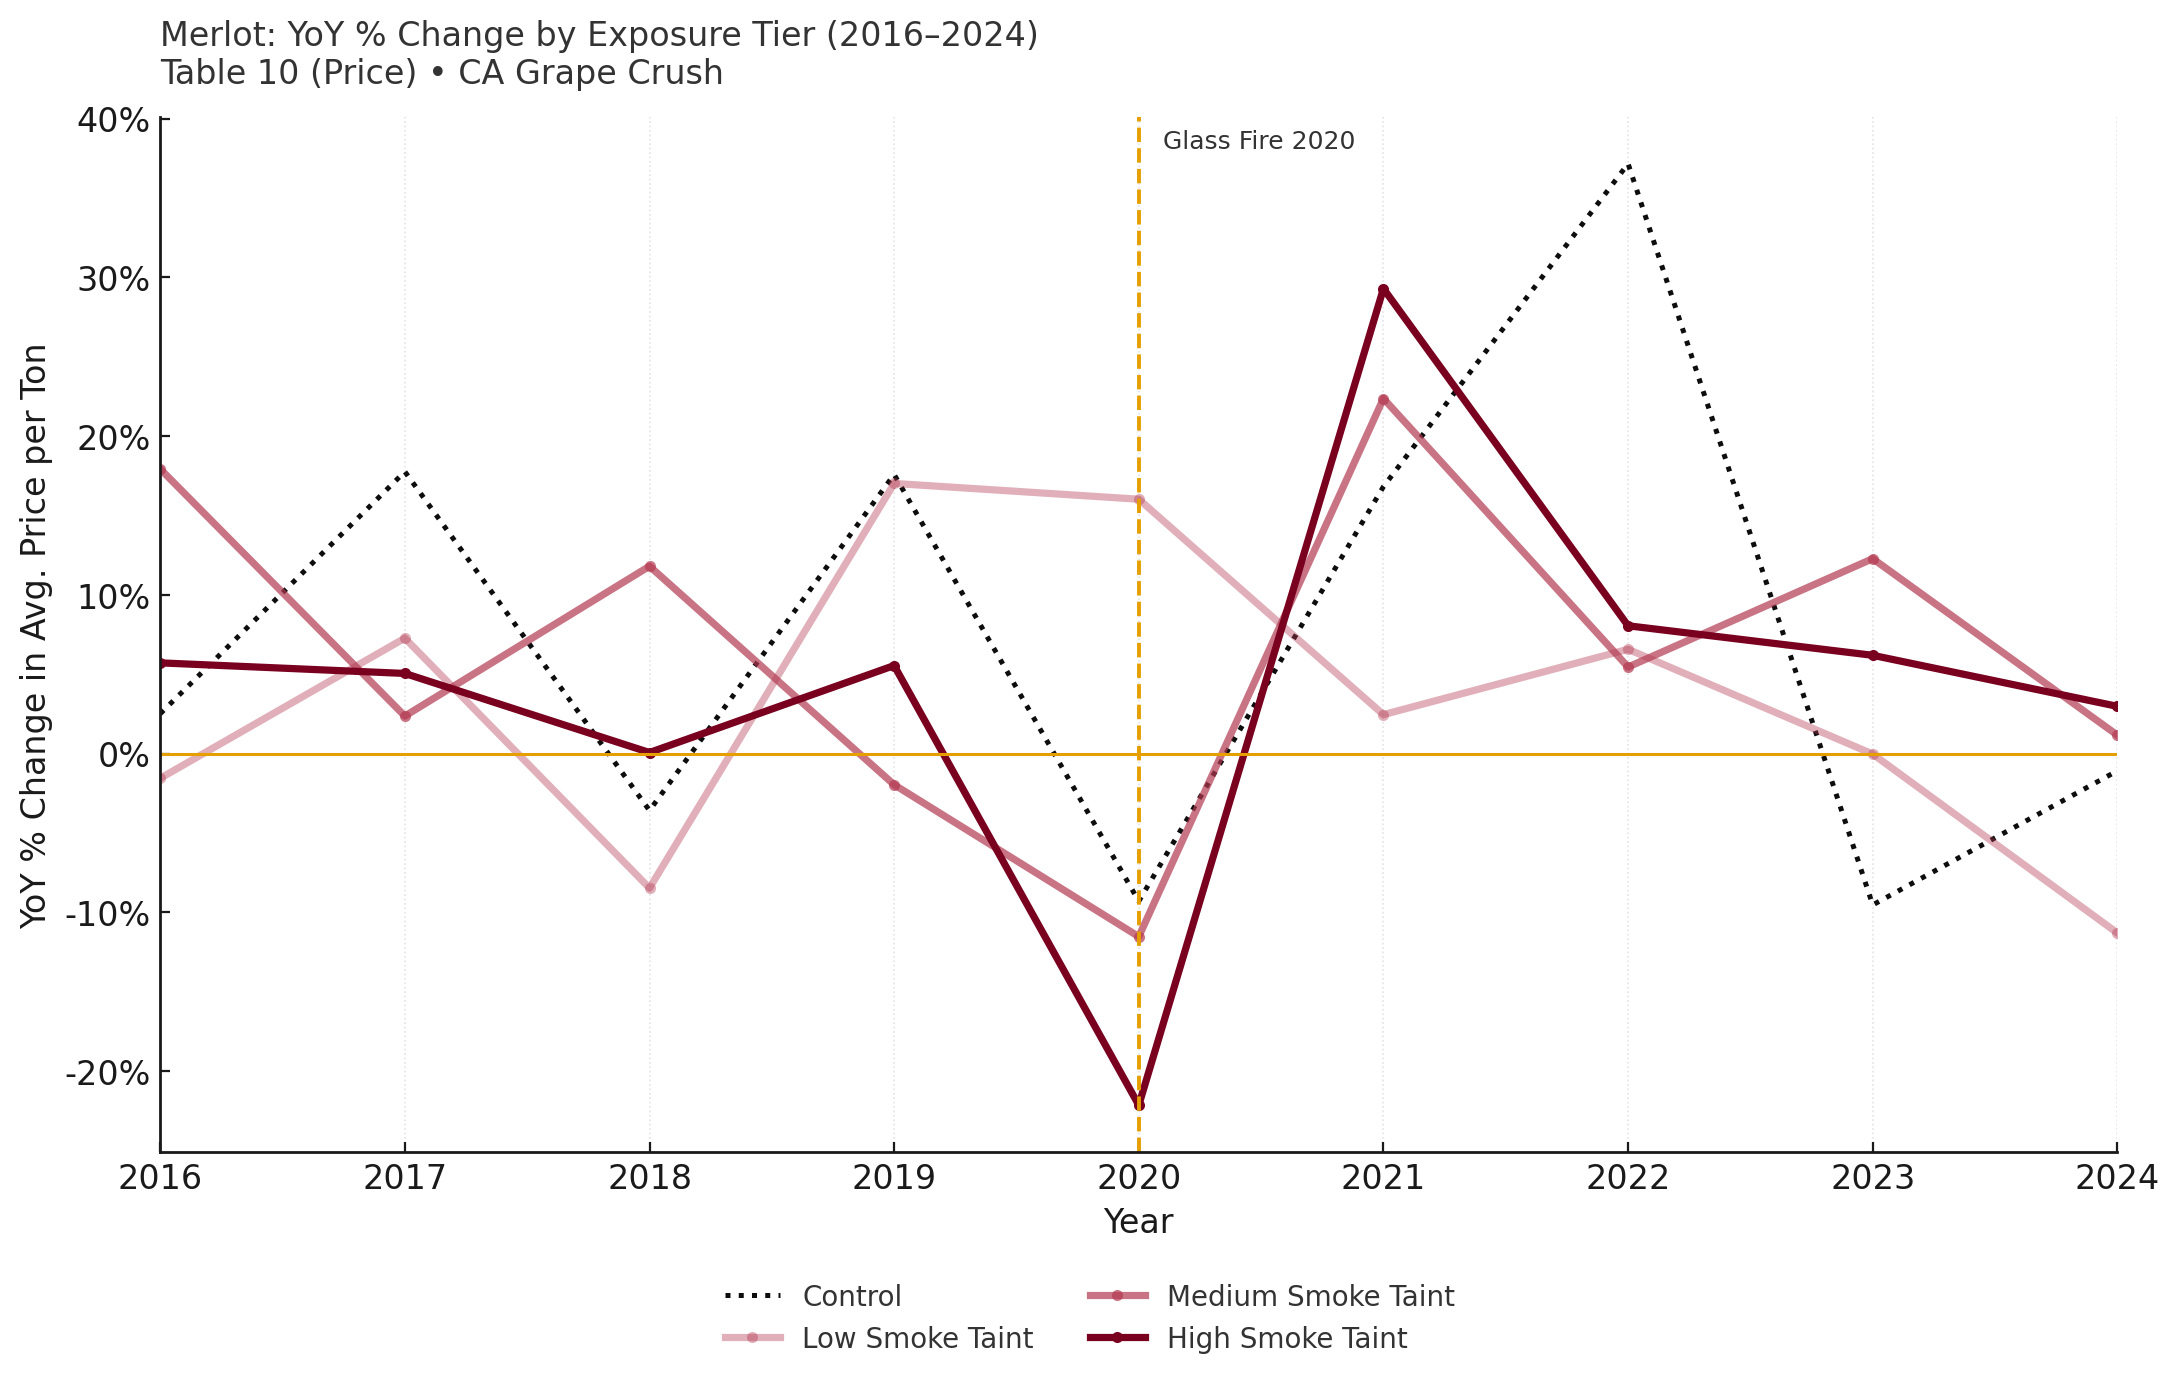
On the charts: is there a reason they are all in level terms? Makes it hard to draw conclusions given the level differences. I would have put all of these charts in change terms.
Hi Alex,
Thanks so much! This is super helpful. I like the idea of creating a representative index. We will definitely check out Acker and WineMarketJournal.
Please see the attached for the year-over-year percentage change charts.
How did you define the low, medium, and high smoke taint groups? Your graphs look strange, as they suggest that higher smoke taint wines command higher prices.
Hi Ben,
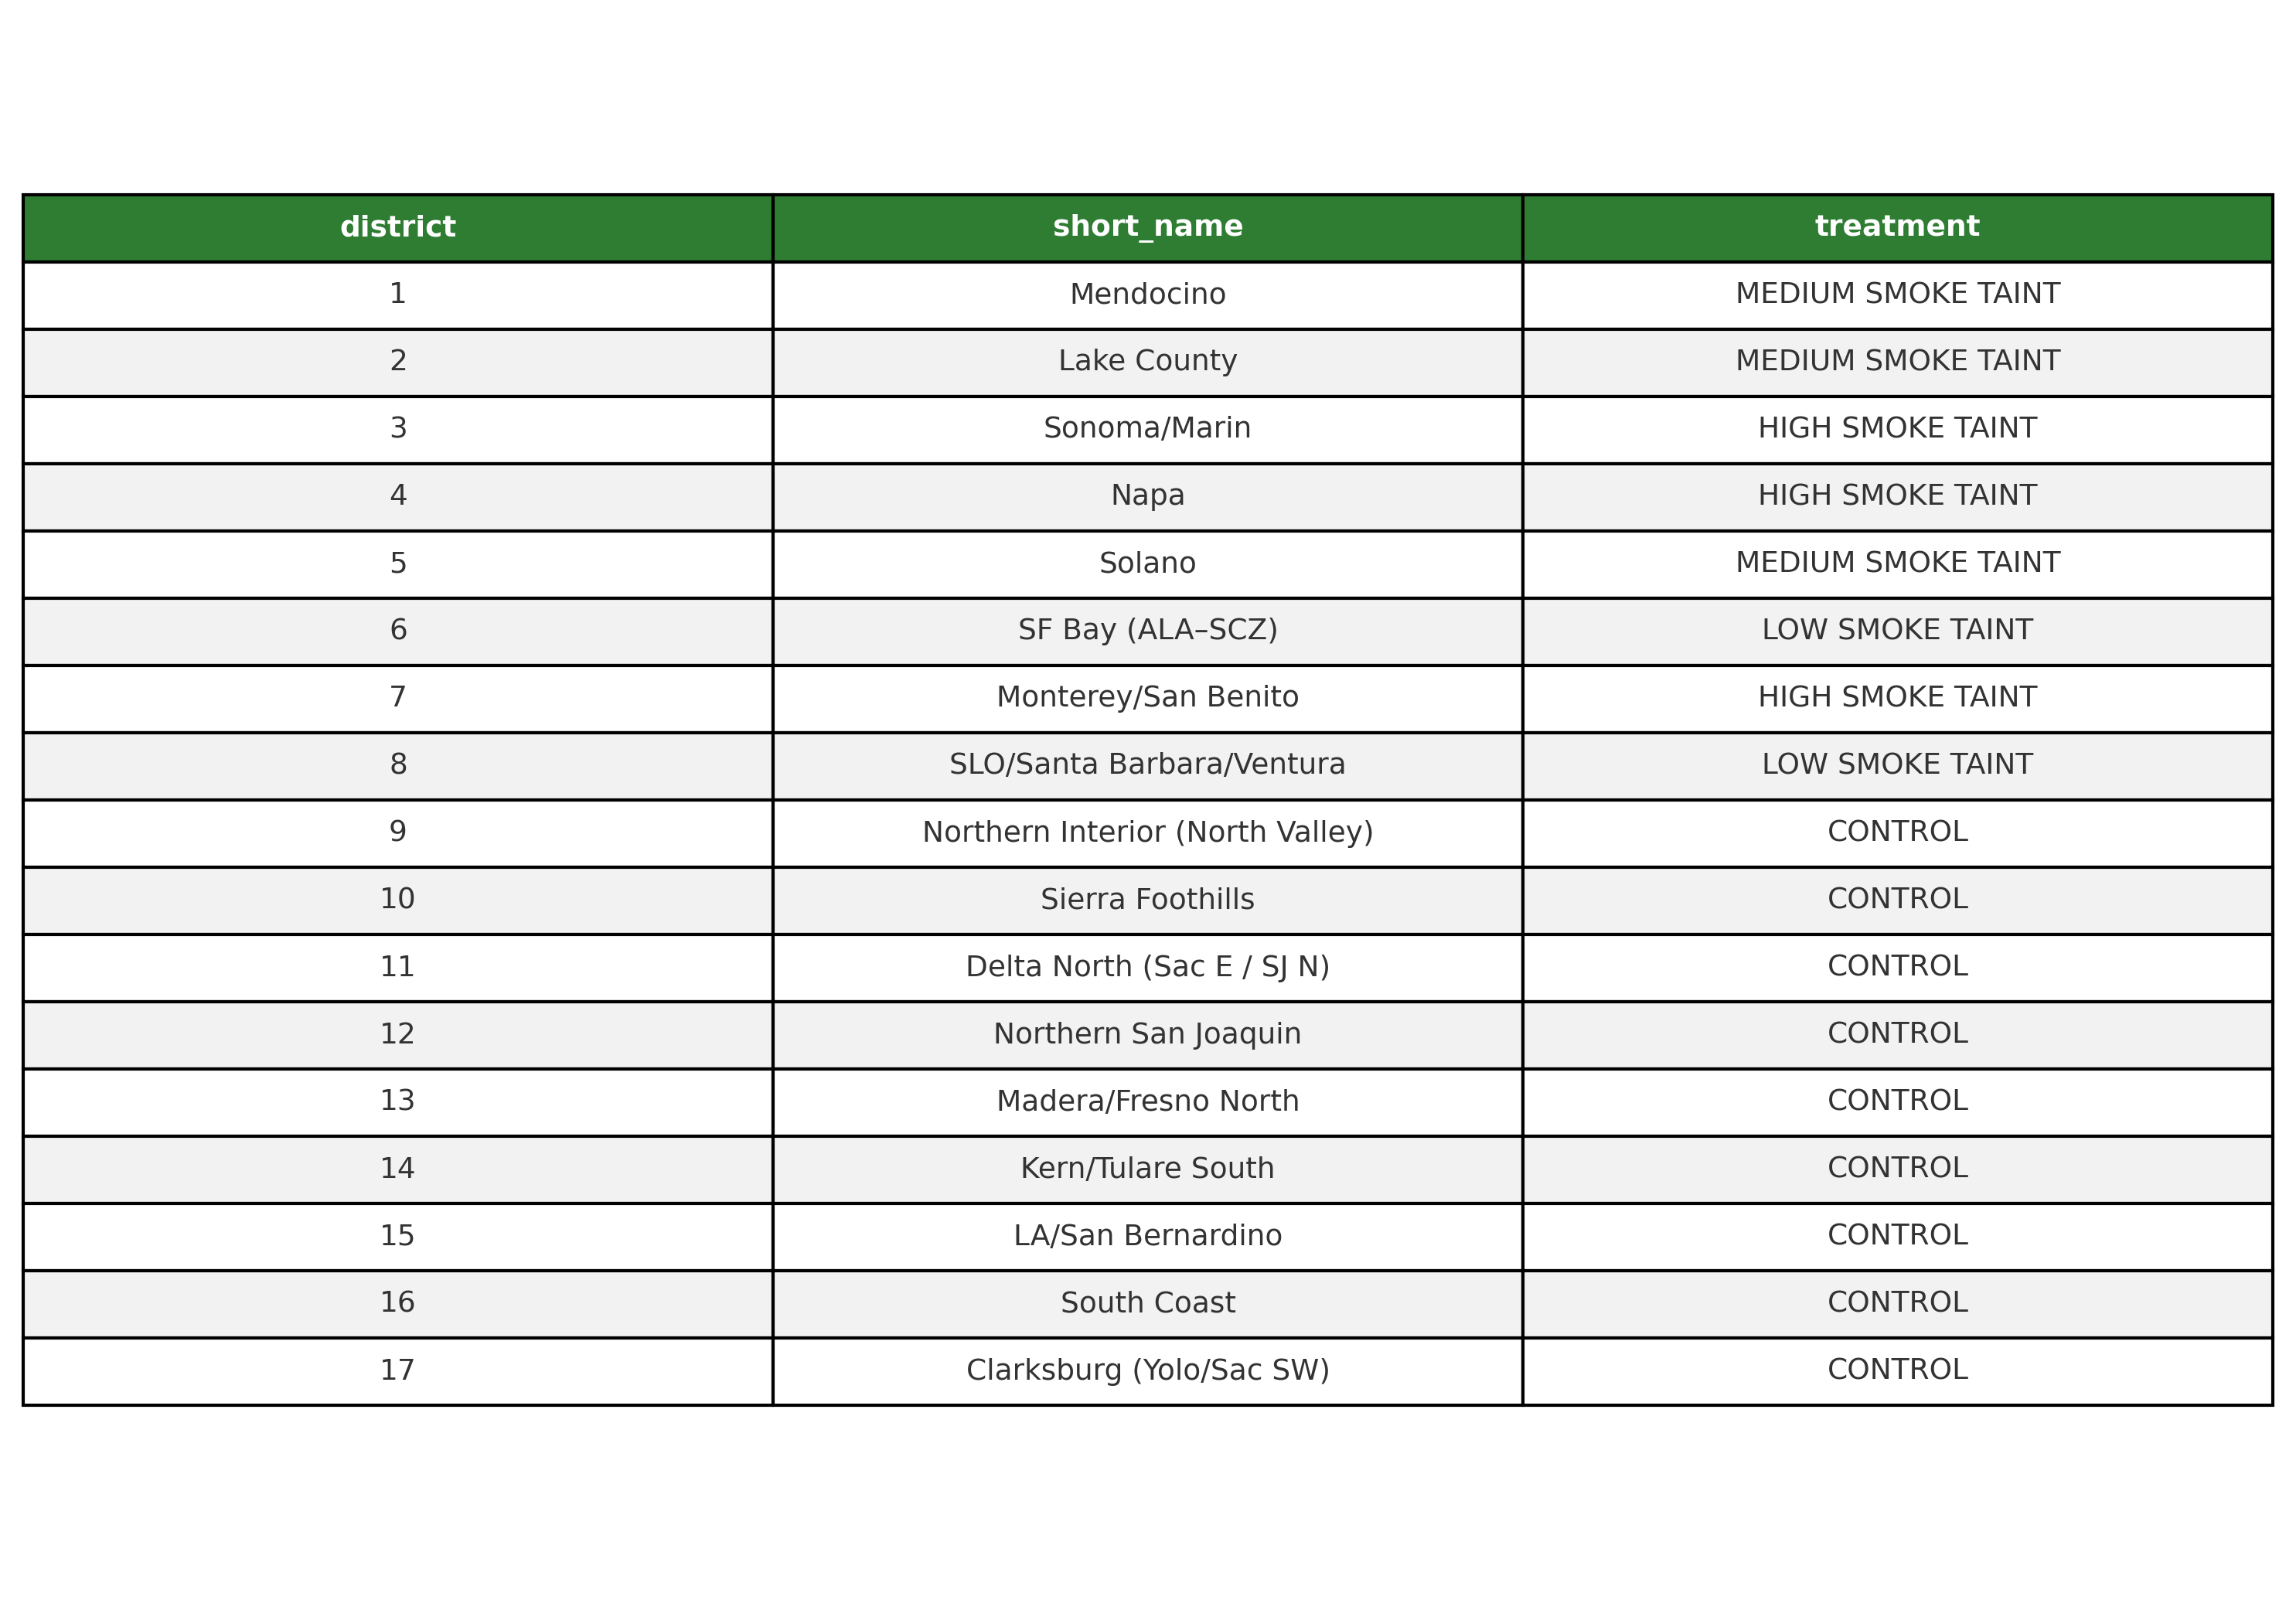
Here is how our treatment groups are initially defined. You’ll notice Napa, Sonoma, and Monterey are the only districts included in the HIGH group as they were the most affected by smoke taint.
This is just a rough sketch based on the data we have available right now. We plan to pull actual smoke data from NOAA and overlay it on AVA maps to get a much more granular sense of the effect on each district.
We welcome any feedback on how the groups are currently defined. Thanks!
Hi Kyle,
For grape pricing you could look at the annual grape crush report. Might be hard to correlate pricing and tonnage directly to the 2020 Glass Fire as there are plenty of other factors at play.
Have you reached out to Liv-Ex directly? I can connect you with someone there if not.
FWIW, I haven’t seen the kind of “dip” in pricing that many would have expected. Prices are down vs. better years (2018, 2019, 2021), but not in the kind of panic dumping way that some might expect. I would argue most prices for 2020s are within an increment of 2017s.
Hey Adam,
Thanks for your suggestion. The above charts are actually already using the CA grape crush data, specifically table 2 for total tons crushed and table 10 for non-related purchase prices.
Thanks for your insight on prices – it’s interesting to hear the 2020s aren’t trading that far below 2017s. Do you think that, after the 2020 fires, once news spread that many 2020 wines would not be picked/released, there was a measurable impact on secondary trading in previous vintages?
The hypothesis is that consumers who would have bought the 2020 release may have shifted purchases to prior vintages, creating a demand shock that increased prices. We’d be interested in studying this substitution effect.
We did reach out to Liv-ex last week and got a response from their marketing team. Short story there is that they’re unwilling to collaborate with us at this time. I think given the proprietary nature of the data and their focus on working with those ITB, they don’t often collaborate with researchers. If you think it’d be worth a second shot, it would be awesome if you could connect us with a contact there!