If wines get better with age, why do their scores go down?

Hi everyone,

So here’s a ridiculous post.

We’ve all read that the full potential of (most) great wine is only revealed with age. Yet to me, it seemed that the opposite trend was true on Cellar Tracker; scores seemed very high for young wines and drifted down as vintages get older. This flies in the face of conventional wisdom, at least for age-worthy wines over a timescale of a few decades. Was I seeing things? I decided to do a little digging.

I wanted to choose wines widely considered age-worthy. Who can argue with First Growth Bordeaux? So I graphed the average Cellar Tracker scores of all five First Growths as a function of year. I chose 2000 as a cutoff: 25 years seems long enough to establish a trend, have enough vintages to smooth out vintage variations, be enough time to have an appreciable effect on the wine itself, and limited enough that I could type all the scores into a spreadsheet in a reasonable amount of time. Here are the results:
Lafite
Latour
Margaux
Haut Brion
Mouton

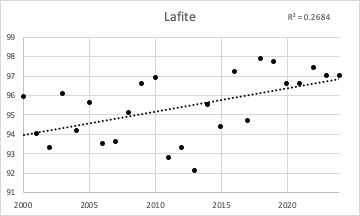
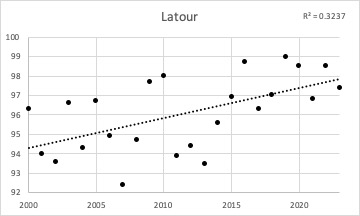
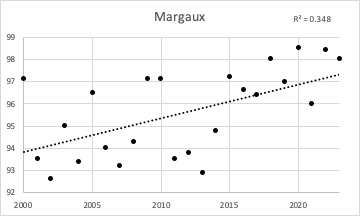
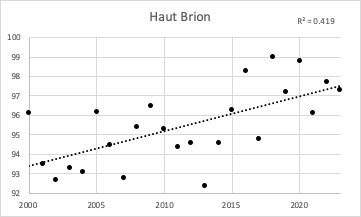
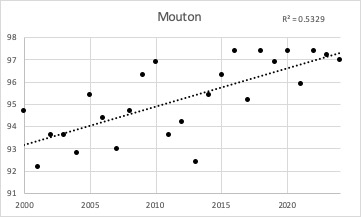
As you can see, I wasn’t making it up! The scores for all First Growths trended downwards as the wines got older. Not a single exception.

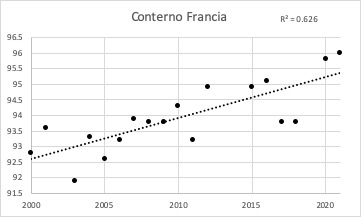
Well, I thought, maybe it’s just a Bordeaux thing. I tried to think of a wine that many consider to really require time in the bottle before enjoying. I came up with Barolo and chose a classic producer and a classic wine: Conterno Francia. Same trend!
Conterno

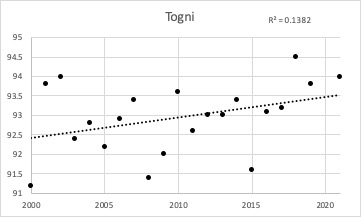
New World Cabernet? I picked a producer that is generally considered to produce wine that ages well. I came up with Togni, just because I’ve had some aged Togni that I really loved. Same finding!

Togni

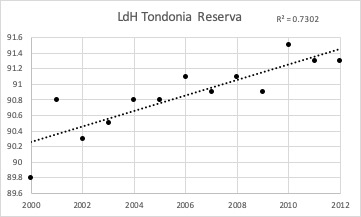
Let’s do another one. What’s another region that supposedly ages well? Rioja! A classic producer that people love to drink after decades in the bottle? How about Lopez de Heredia? I picked the Tondonia Reserva. (Didn’t go with Gran Reserva because I was only doing scores since 2000, and there’s only two vintages in that case). Same thing!
LdH

This is far from comprehensive. I admittedly came up with these wines just off the top of my head. But it does seem like there’s something there. I didn’t find a single exception. Personally, I’ve had many aged wines that were delicious and I really think benefited from time in the bottle. So I’m not bashing old wine. Interestingly, the Togni had the least significant trend, which I wouldn’t have guessed.

I really don’t think the trend I found across all these wines is purely coincidental though. There’s something at work here- anybody have any guesses? Here’s some of mine:

  • Poor storage has greater affect as time goes on, which could account for scores drifting downwards.
  • Score inflation is a thing in professional publications, maybe new reviews just score more generously?
  • Primary fruit driven flavor profiles may be more “impressive”, similar to the way big bold Cali Cabs can dominate tastings and get big scores.
  • Climate change? Improvements in wine making technique? Maybe, but are the wines being made now definitively better than 20 years ago? That’s a genuine question.
  • I thought about regression to the mean, but I don’t think that’s the case here because score trends would be just as likely to increase as decrease as more users enter scores, so you should see wines with trends going both ways.

But I’m curious what you all think? Do you believe the trend is real? What might account for it? Is this even an interesting question? Do I need to find a better way to spend my time?

Thanks for indulging me. If not WBers, who?
Noah

3 Likes

Am I missing something? It sure looks like scores are going up with time.

5 Likes

I think you’re conflating scores dropping with age and score inflation with recent vintages.

9 Likes

Right…these appear to be effectively vintage charts. The higher scores in more recent vintages are explained by better winemaking and perhaps some grade inflation. To chart what you’re trying to chart, you would need to pick one wine and track average scores posted in CT for that wine each year.

8 Likes

Hi Noah, I seriously doubt both the premise and the analysis. But I welcome your note and question. But even if the premise were true it is almost impossible to prove.

To do what you are trying to do, you need to find several professional wine critics and then track their scores of every vintage of the same wine over a period of 20+ years. This way your are measuring apples to apples in terms of who gave out the scores. This is actually quite difficult in reality as most critics don’t do retrospective tastings often enough to create the population statistics you need.

CellarTracker scores are not data and cannot be used statistically as if they are data. CellarTracker scores are averages across many users who are all different and are not professional tasters. i would never trust CellarTracker scores to tell me any useful at all.

BTW most of your R2 values are too low to be considered acceptable in terms of establishing a statistically valid correlation.

Annecdotally I have found that my enjoyment of wines increases with bottle age. Thus I do not need anything more.

Also as an aside the limitations and subjectivity of the 100 point scale is another problem for you in this type of analysis. To illustrate this, the true variance on any given score is probably at least several points. When you look at your vertical axis on your plots, a 3 point variance (uncertainty in any given score on any day) it represent 30% to 50% of the entire range being plotted. this is not good.

Cheers and keep up the interesting work
Brodie

3 Likes

@Eric_LeVine who once shared an AWESOME chart on Bordeaux scores over time (which I searched for, but could not find).

Your are talking about this: Happy holidays + new data from CellarTracker! (24-November-2021) - CellarTracker

Except MailChimp seems to have taken a shit on the charts you want to see…

Sigh.

maybe Im misunderstanding you, but I think that’s what I did.

I think what James is saying is that to demonstrate your hypothesis, you need one plot per wine per vintage with the horizontal axis being the date of the score for that wine in that vintage

2 Likes

Different vintages are different wines. I’m referring to the need to track a single vintage of the same wine over time.

2 Likes

Exactly. I posted at the same time; you said it better.

1 Like

Hi Brodie-

I’m not really trying to prove anything, nor is there really a premise, other than noticing CT scores seem to be higher with recent vintages and lower with older vintages. That’s all. Because this goes against what we commonly hear, namely that great wines get better with age, I made the graphs just to see whether the trends I noticed were all in my head. And I found that all the graphs all trended in the same direction. I found that surprising, so posted it.

And I don’t know anyone who would have even a passing interest in these silly graphs in real life, but thought if anyone might be interested other than me, it would be WBers. Again, not setting out to prove any specific premise. Sorry if that wasn’t clear.

Noah

2 Likes

Oh I see what you’re saying. That makes sense, though very annoying to enter into Excel!!!

I don’t understand the pooh-poohing you’re receiving, I think you’ve uncovered an interesting trend.

One thing to control for would be the time period that the scores are given. The older wines have, on average, scores that were given longer ago. It’s possible that the CT userbase composition, or their scoring preferences, has changed over the years in a way that has affected the scoring. This happens a lot on online movie rating websites like imdb and letterboxd. It would be interesting to restrict it to just scores that were awarded within the last X time (one year doesn’t look unreasonable, on a quick look).

Another possible confounding factor is the types of user rating wines at different ages. It may be that the type of person drinking these wines young is a different kind of person (or rates wines differently) compared to someone drinking them when they are much more mature.

Setting those confounders aside and accepting the trend as a given, the two most obvious (to me) explanations are older bottles getting dragged down by some flawed examples or ones that weren’t stored correctly, and better winemaking in recent years leading to genuinely better wine being produced. Both of these (and the CT trend as a whole) are good arguments against cellaring wine, it seems.

5 Likes

That could very well be! In fact, I proposed score inflation as a possible explanation in my initial post.

Yes, exactly- recent vintages, aka younger wines, get higher scores than older vintages. That’s what I meant to convey.

I think you’re suggesting that it would make more sense to reverse the X axis, with new vintages on the left side and old vintages on the right. That would demonstrate the falling scores over time. If thata what you’re saying, then I agree! Actually, I tried to do it that way originally, but that would mean a decreasing X axis. Whenever I selected that function Excel did a weird thing where it flipped the y axis to the right side of the table which made the whole thing even more confusing to look at. So I did my best without spending a huge amount of time fiddling with formatting. I’m sure someone who knows what they’re doing could have made much better graphs.

My bad, somehow I thought you were tracking the scores of the 2000 vintage over time.

Yes, it’s pretty well documented that scores have been going up over time, you’re data demonstrates that well.

Noah:

Thanks very much for posting…I love these types of questions and cellar tracker is a great source of “data” and very much worth looking into. I’m not sure if I understand the analysis but let me say this: Old wines are just different, not necessarily better or worse. Some people like aged wines that have rounded out and gain complexities of age, and some like young wines with a refreshing kick and complexity of all the bright phenolics and grape clones used. Also, I think some love of aged wines comes from looking at a fifty year old bottle and the romance of having an ancient cellar filled with these (and I’m dating my wine appreciation…old wine cellars is definitely an old school or aspiring upper middle class 50 year olds thing I think). That said…

Using average scores for vintages is not the best data because new vintages are scores based on tasting a young wine only, and older vintages would be a blend of tasting the wine as young and old, and the longer the time period, the more chance of compromised (or less that optimally kept) bottle scores getting in the mix. Although many decline to add scores for damaged wines, one 80 point score will affect the average. You could look at scores over say the last five years for all the wines? So older wines would be being judged on their mature qualities, vs. younger wines on their youthful ones. Or you could look at scores for each wine at say around five years old, 10 years old and 20 years old (like plus or minus a year?). There are groups that do a 10 year old Bordeaux tasting dinner…also maybe 20?

Or better yet, I think one might ask for testimonial data…capable or professional tasters…that have tasted the same wine at different stages. You’d be amazed at the memory some of these people have. I can still remember the 1986 Mouton I had upon release. Anyway, keep asking the questions…it’s a worthy discussion.

So the question to the group is: Can you give an example of a singular wine that you have tasted at various levels of maturity, and did it “improve” or not? And did it maintain its score? Did a 94 point Bordeaux score similarly at 5, 10 or 20 years?

The cynic in me thinks that professional reviews are high when the wines first hit the market to help the producers sell a shit-ton (a much larger volume than a hectoliter) of wine. That plus the 100 point scale includes 5 points for ‘potential’ which is always awarded in full to wines with a proven track record. Not every wine lives up to its potential. But for me, I greatly prefer wines with significant age over recent releases.

5 Likes