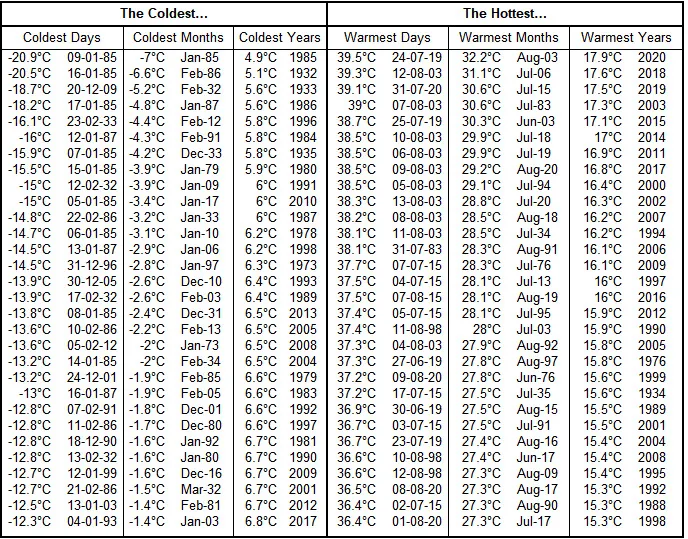
It’s very frequent to generalize about vintage character by calling them “hot” vs “cool”. Saw some very interesting data on this from Bill Nanson’s Burgundy Report (available at this link – 19. Côte d’Or: Hot & Cold – Burgundy-Report and I’ll drop in the key chart below).
If you look at overall “hot vs cold” measured by average daytime temperature over the growing season, 2018-19-20 are the three hottest vintages in Burgundy history (or at least since 1973 when Bill starts measuring). Surprisingly, seemingly stylistically “cool” recent vintages like 2011-2014-2017 are also all way warmer than historical norms – in fact all three were considerably warmer than 2009 by daytime temperature. 2017 even had a warmer summer than 2009.
However it’s striking to me how the pattern of heat differs between vintages. 2018-19-20 all look hotter than 2003 overall, and frequently people will compare one or more of those years to 2003 based on that. But 2003 is glaringly different from all those years in terms of extremes of heat. E.g. 2018 is “hotter” than 2003 based on overall average daytime temperature, but ten of the thirty hottest daytime temperatures ever measured (since the 70s) in Burgundy occurred during 2003, while not a single one occurred during 2018. (By daily highs 2019 and 2020 were also “hotter” in the extreme than 2018, as five of the hottest days measured occurred during 2019 and four during 2020).
When you do it by hottest summers – perhaps a better way than extreme days – 2018-2019-2020 all seem fairly similar and unusually warm. But they are still significantly cooler than 2003, as 2003 had the hottest June-July-August on record by far. In fact June in 2003 was hotter than July or August in 2018-19-20! June and August were so historically hot in 2003 that you can really see the pattern of relentless heat over that summer, interrupted by an “ordinarily” warm July.
Some stylistically warm years like 2009 hardly rate based on temperature metrics alone – 2009 is firmly in the middle of the 21st century pack in terms of overall temperature and has no daily or monthly extremes.
2010 is overall the coolest vintage in something like 25 years (since 1996), but also one of the best. Next coolest over that period would be 2013 and it’s a terrible vintage. Go figure.
Of course rainfall data is missing in all this and is critical, since it tells you not just how warm but how sunny a year is. But I do frequently see people generalizing based on claims about warmth vs cold without specifying sunshine (although they probably mean to include that conceptually).
Bill’s key temperature chart is below – hope he doesn’t mind my copying, people should visit his overall site at https://www.burgundy-report.com/, it’s great!
I was surprised how 2014 the 6th warmest year, even if it didn’t have any of the warmest days or months. I guess they had a warm winter or autumn with a somewhat cooler summer that year?
Thanks— it does help put things into perspective. I think his NB is important to understand the delta between the cold and hot temp averages (I couldn’t quite believe them at first): “ NB: The average temperatures (both months and years) for cold are the average night-time temperatures. Likewise for the heat they are the average daytime temperatures”.
This is perhaps as good a proxy as we can get, but relating to wine quality, I would prefer a more detailed analysis of temp data and trends between flowering and harvest, including the number of days (length of this part of the growing season) and within this window, growing degree days, all the highs and lows (extremes and averages), and as you suggest precip. added as well. I do remember a scientific paper that showed all of this, I’ll see if I can find it.
I actually think it’s the opposite. If we consider 2014 and 2017 “cool” vintages, the absolute temperature data is not dispositive at all! The 2019 and 2020 vintages are quite different despite very similar temperature data. At least as far as Burgundy goes, I’m a big believer that temperature is very much not destiny.
It seems temp is something they’ve been figuring out. What seems really ruinous are things like frost, mildew, etc.
I’d be interested in seeing week to week temp swings, precipitation, etc. Listening to growers tell their stories of the year, they seem to more often highlight key moments in which the season hung vs general trend being hotter or cooler. In a way, sustained warmer growing seasons seems to give them more optionality to get the grapes to full verasion
100%. As a Volnay producer said, it is easier for them to make good wine right now than it was 20 years ago, the challenge is unexpected events like frost in 2021. One producer laughed at me this year when I asked how they had been dealing with the very hot weather and said it hadn’t been at all (unlike in southern Italy), and told me if I wanted to do harvest I should bring rain gear because they expected it to be damp and unpleasant (though a late heat wave changed that for a week and a half).
Seems interesting indeed.
But need to gather and analyse much more data. I think one notable producer, who’s name escapes me, mention that even though 2018 and 2019 weren’t that far off as far as average temperatures go, there were crucial differences in precipitation as a whole, and number of sustained high temperature days with no cloud coverage + number of days between rain events. The situation in 2018 led to many vines experiencing stress or whatnot, only older vines seemingly not bothered due to their deeper roots and perhaps some other things.
Not exactly relevant but in my part of Europe 2018 left a big impression on everyone’s memories because of how dry that summer was. There were large periods of time with absolutely no rain whatsoever, longest being 4 or 5 weeks I believe, which is historically significant in the region where it’s hard to get a week without some rain. I believe Burgundy experienced something similar and could be the key to understand that vintage.
For the record, wines from 2013 have so far been my favorites along with 2010 and 2019. Granted I am a cheapskate and relatively new to this game. Average temperatures do seem to be a poor surrogate for farming any crop, let alone one so precious as the Pinot noir grape.
Mostly talking about expectations of warmer years overall. Also outside of Burgundy. Some producers seem to adapt well, but there might be limits at some point.
And yes there is a lot of nice wine made. But still a lot of high alcohol/darker fruited wines made as well in Burgundy.
This is what I was also going to say: temperature data is interesting, but it doesn’t tell us a whole lot without including rainfall and sunshine data, which makes for a more complex analysis. I think calling a vintage “warm” or “hot” is shorthand for “very ripe”, which is partially, but not only, about temperature.
I can’t tell from this – are the hottest and coldest years based on the average temperature over the course of the year? I think it’s temperatures during the growing season that determine the character of the vintage, not what happens in January, February or December.
One thing that makes me suspicious of the validity is the ranking of 1985 as a cold year. It was a ripe vintage. From the cold day figures in the table, it appears that the average for the full year 1985 may have been dragged down by some very cold days in January, long before the vines are “awake.”