We were able to generate these charts before in the chart tab of the web version but it is nice to have them now on the app… i like the option of seeing the results by vineyard !
1 Like

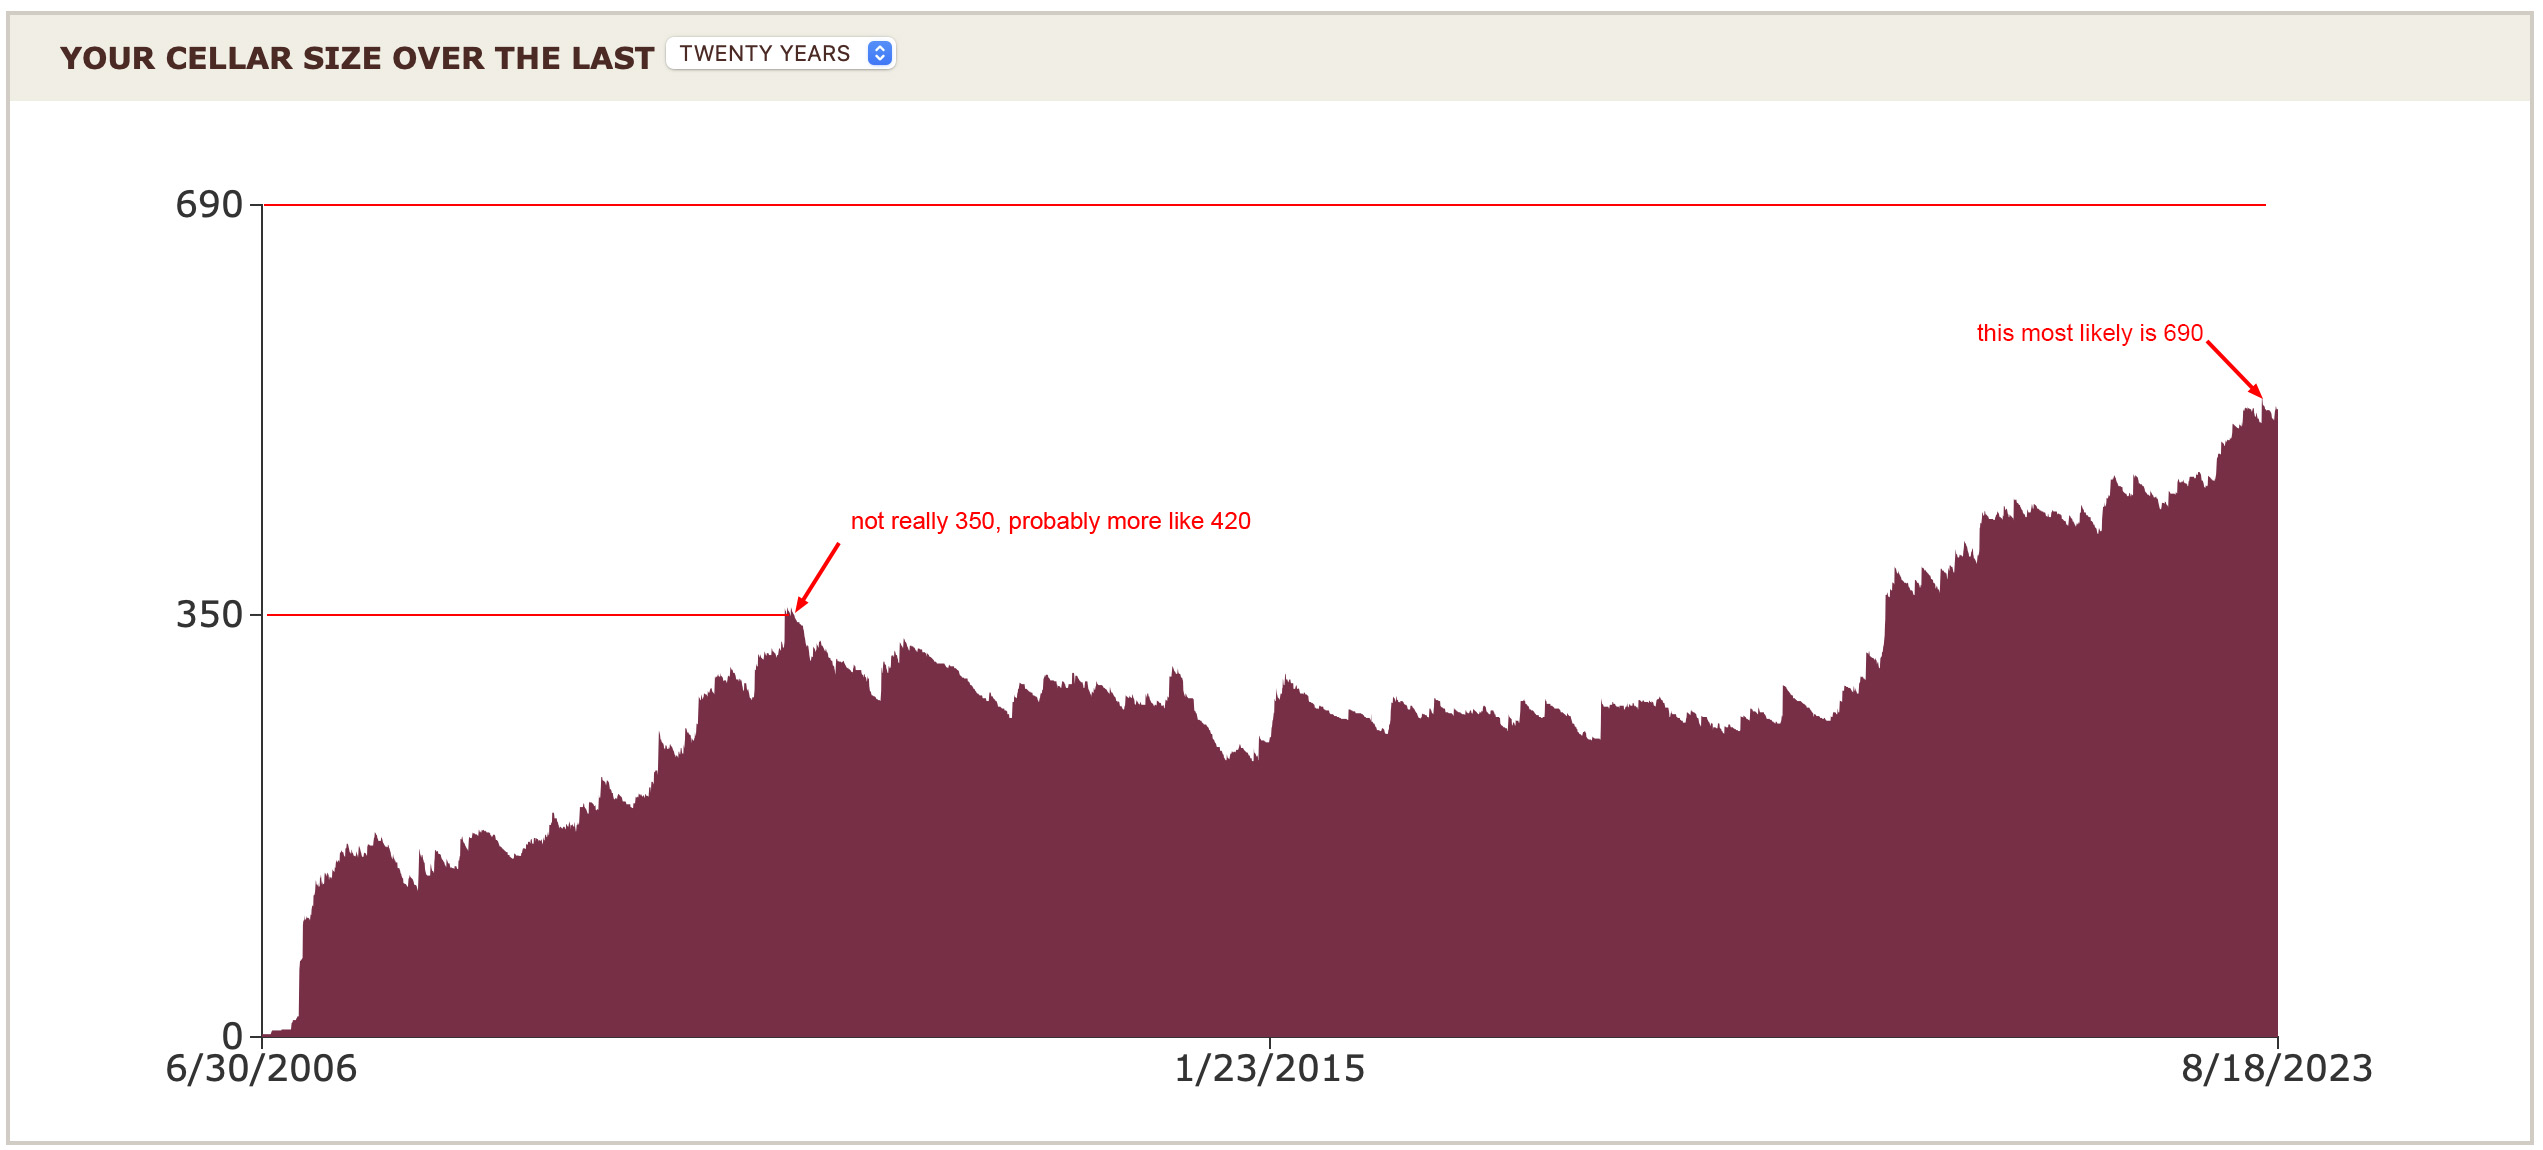
I have a small critique regarding the charts, particularly with the cellar size graph. The visual graph and the numbers do not line up properly. The top vertical number usually is the “peak” number of bottles one has or had in their cellar but the graph itself does not correctly display the proper height. See my example below.
5 Likes
Pretty much the same for me with the only difference being concerning —> ![]()
My charts look exactly like I expect them to…fortunately and unfortunately. I also mess around with it on a regular basis so not big surprises. Nice feature though.
Best performance chart so far, 60 degrees up slope!
I wish my brokerage account looked this good ![]()
7 Likes
Each bar in the chart should link to a list of bottles in that ‘ready to drink’ category, or at least link to the ‘ready to drink’ report, positioning the top of the list shown to the first item of the selected category.
However, this report serves to highlight the inconsistent and inaccurate begin/end drinking window dates in CT, as well as the difficulty in general of coming up with a useful drinking window.
4 Likes
@Robert.A.Jr 's looks like this, just inverted
3 Likes
Buy high, sell low baby!
1 Like
2 Likes
Showed the number of bottles over time to my spouse, whose eyebrows went up further than I’ve seen in a long time.
I tried to reason with her by saying, “Hey, at least the growth is linear and not exponential.”
That didn’t help.
4 Likes
You were expecting a pat on the back?
“Good job, honey! In what categories are we under-purchasing?”
5 Likes
I wouldn’t be surprised if @Charlie_Carnes ’ wife said this very thing
So what I’m hearing is we need some way to track and chart the wine we didn’t buy…
5 Likes
Genius. Call it the Spouse Saver Chart
3 Likes
Although I don’t buy wine intended as an investment, for some folks, a chart that of valuation (or valuation vs cost) might do the same.
Good in theory until you have the following discussion:
“Hey Honey, remember that bottle that cost us 30$ and is now worth 1000$?”
“Yes.”
“I pounded it at lunch with another wino.”
Valuation loses it’s appeal at that exact moment.
5 Likes
Did not know there was a beta app out. I used to get them, Android version, when Dan was doing things. I think he moved on. Good guy and smart!
1 Like