Some food for thought (or drink). Here’s a chart that the American Association Association of Wine Economists just tweeted out. (This will eventually go up on their website, but their charts go out via Twitter first.)
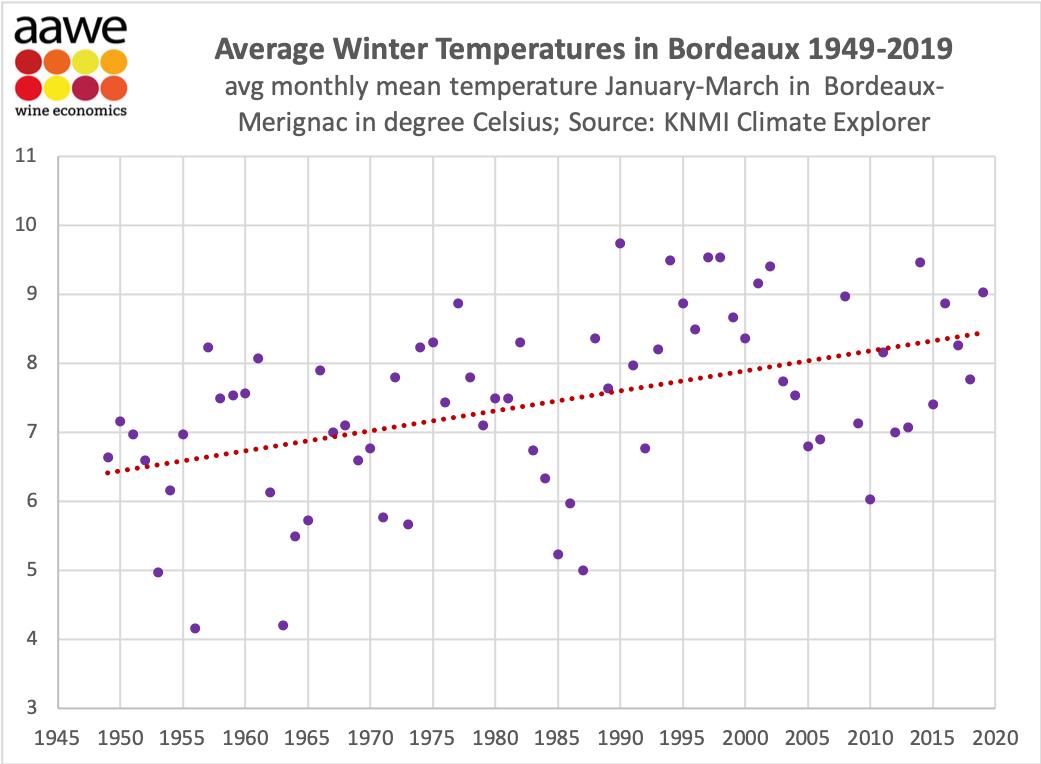
Average January-March temperatures have risen by 2C – almost 4F – in the last 70 years.
I’m not sure how much differerence these winter temperatures make to wine, since the vines are dormant in that period. But it no doubt reflects fewer deep freezes.
If they post a similar chart for temps over the growing season, that would be even more interesting.
1990 is the warmest on there. I saw a similar chart for Napa. I think there may be a strong “colder= poorer quality” correlation but there’s not as strong a relationship between warm temps and quality.
And these are winter temperatures. Note that '03 and '09 are below the trend line, though they turned out to be warm vintages as those years progressed.
Isn’t the summer temperature more important. 2003 on this chart, for example, isn’t that high.
I don’t know about Bordeaux, but in Burgundy, it has seemed like the main impact of warmer winter (or early Spring) weather has been greater damage from frost, as there have been occasions like 2016 when warm weather causes vines to leave dormancy and then for colder weather to come in an cause trouble to vulnerable vines.
While I’m sure this is a fine way to understand high level change over time in Bordeaux, I don’t know that it helps us all that much (if we’re trying to understand the impact on quality and production of fine wine). More interesting would be things that specifically relate to wine, and this requires significant interpretation. Examples:
- Do hard freezes matter? If so, how many days had below freezing temperatures?
- Are there pests that certain temperatures remove? Are there more or less of those temperatures?
- As others have mentioned, what about changes in summer temperatures? Do day/night temperature swings matter? Ok, how have those varied in the last 70 years?
I’m sure we can come up with many more examples,. This chart reinforces the notion that climate change in winter/Bordeaux is real but opens up more questions than it answers.
Did you read my comments?