Have we the same palates?

Have we the same palates? I have the chance to have collected for many of my dinners the votes for the best wines for everyone. We are generally 10 to 12 diners and we vote for the four or five best wines of the dinner.

Of the 226 dinners, there were 186 dinners where there were votes, concerning 2065 wines or 11.1 wines per meal. I have kept the votes of the participants and for each dinner I have the vote of consensus and my vote. We voted generally for four wines and 26 dinners had five votes. For consensus I sometimes calculated more votes than the number of wines voted by each person.

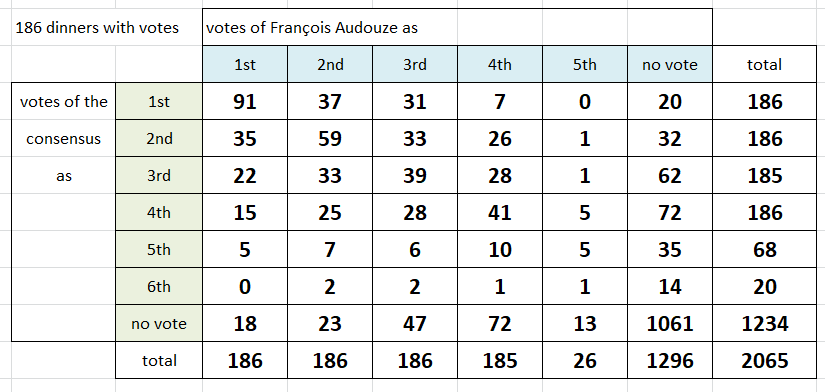
The table shows the distribution of votes between my vote and the vote of consensus. This sheet reads as follows: out of 186 wines that I have classified in 2, there are 37 that are first for the consensus, 59 voted second also by the consensus and 23 that do not appear in the vote of the consensus.

Thus, only 91 wines out of 186 dinners are at the same time first for me and for the consensus, ie only half. If we consider the wines that are in the first three for me and are in the top three of the consensus, there are 380 out of 558 possible wines, which makes 68% of consistency between the consensus and me.

The wines of the 186 dinners have an average age of 51 years. The 1061 wines that are neither in my vote nor in the consensus vote have an average age of 44.3 years whereas the 91 wines which are first for the consensus and for me are 73.3 years old. In my dinners, the oldest wines are the most prized.

If I consider the wines of Romanée Conti, there were 113 in 186 dinners. 67 are in my vote and 87 are in the consensus vote. And if 23 are first for me, 30 are first for consensus. For many guests, the novelty effect of Romanée Conti’s discovery plays. It is the same for Yquem, present 122 times in these dinners, 47 times in my votes and 70 times in the votes of the consensus. The magic of the labels plays.

Globally if there is a relative coherence between my votes and the consensus votes, what strikes me is the diversity of all the individual votes. And this diversity is incredible. The consensus vote is an average and it is understandable that there are not too many differences, even if for example 20 wines that I voted as first are not included in the consensus vote which includes mine. But taken one by one (which I have not computed), the votes are incredibly different which makes me think that the diversity of palates is incredible.

Is the vote done without communication between participants?

Francois, there’s no question there is a wide range of different palates and different preferences. Your numbers confirm it.

I might also suggest that the folks who you taste with might be a particular self-selected group. In other words, you don’t have any sort of randomness. You have people who have grown up winnowing their taste to appreciate and understand a certain style of wine.

Yet even within this self-selected group Francois finds a striking diversity of palates.

I found that even with people who have been tasting together for many years, and who often know a lot more about wine than I do, there is rarely consensus on individual wines. I’ve kept notes going back 20 years to remember what my opinion was and to see if I am at all consistent, but the consensus votes were all over the place.

Fun exercise.

I may be missing something, but it looks to my eye as though the first 4x4 grid aligns perfectly, with the “diagonal” dominating, and with appropriate fall-off as you move away from the diagonal.

Even (row-5) & (column-5) aren’t off by all that much.

And there’s massive agreement on (no vote) & (no vote) [to the tune of 1061 votes].

If you fire up something like Excel, and plot a “3-D Histogram”, then you’ll see how the diagonal dominates, forming a “ridge” or a “spine”, and how everything falls off from there.

PS: Is there a column-6 for the votes of Francois Audouze?

This also ties into the wine breathing discussion, people have different tastes.

These results look reasonable for a somewahat self selected group of non identical people, if you follow. Very interesting.

At our tastings (Toronto Winetasters) which is also self selected group, but I think probably somewhat more broadly based, certainly in terms of experience, it’s interesting that often a wine will “polarise” the group (getting top and bottom ranks), this is not uncommon with older wines that might be described as just slightly past their peak but still vital. Of course the group score is then middle of the pack! (Which is why I’m not big on stats).

Yeah, I see the same pattern.

The table shows Francois’ rankings vs. those of the group mean, or “consensus.” There is good agreement there.

If you read the rest of his post, I think you’ll see that he is saying that there is a large variance between the rankings of the individuals that make up the consensus. That is not shown in the table but I think it’s the point he’s trying to make when he says

taken one by one (which I have not computed), the votes are incredibly different which makes me think that the diversity of palates is incredible.

It also demonstrates that averaging out rankings among multiple tasters can hide important differences between them.

But it also seems like there is “fall-off” down the diagonal, no? Less consensus in respect to wines of lower rank? Also, I must confess, I don’t get the number “1061,” where the two no-vote columns intersect.

The fall off from the diagonal is how one would define variance from the norm. I’m not sure the comments that seem to be to the contrary are taking that into account. That puts aside whether there is any bias of the survey or whether the numbers are large enough for statistical significance. But I’m fairly certain that one could enter this chart as a spreadsheet in Excel, hit a button, and get the relevant statistical information, including variances and co-variances. Basic stuff.

some explanations :
everybody makes his own vote without telling what he votes. I collect the answer when everybody has voted in silence.
Of course, during the dinner, we talk and this could influence the votes. As generally people listen to my comments, the votes should be more close than what I see.

As is said in my text, there are 11.1 wines per dinner. if someone votes for 4 wines (only 26 dinners have votes for 5 wines), he will not vote for 7.1 wines.

As there are 1061 wines which have not had votes from me and which were not in the consensus, it make 5.7 wines per dinner not included either in my vote or in the consensus vote.

Everybody has as many votes as I have, so 160 dinners with votes for 4 wines and 26 dinners with votes for 5 wines. There was never dinners with votes for 6 best wines. But when I calculate the average vote, I could produce the ranking of all the wines of the dinner.

In my votes there are only 26 times a vote for a 5th wine when for the consensus I calculated 68 times a vote for a 5th and 20 times a vote for a 6th winner.

I could compute all the votes to show the differences, but it would be an enormous work.

What has always amazed me is the variety of the votes. It happens very often that in a dinner of ten people, six wines get the privilege to be named first by one diner or more. For me it is amazing as it shows that our votes are influenced by our personal history.

When, for me, a wine is so above the others, I would expect for it 8 votes of first, and it gets only three votes of first !

You have seen on this sheet that 18 / 23 / 47 wines which are in my vote 1st / 2nd / 3rd do not exist in the consensus vote.

For me, all that is fascinating.

Another information :
The wines which are voted either 1st or 2nd have an age of 66,4 years for me and 63.1 years for the consensus.

The 1061 wines which are not in my vote and not in the consensus vote have an average age of 44.3 years, so roughly 20 years less than the best.

It is rather logical because I cherish old wines and I put in the dinners old wines which have a higher status than the younger wines.
A majority of people attending these dinners have not a real experience of very old wines.

(note the calculation of the age is the year of the dinner minus the year of the wine. A 1928 drunk in 2008 has 80 years, and has 90 years in 2018).

+1.

There is always going to be variability, the question is the statistical significance. It seems to me that the numbers are in line with some variability but overall correlation. Given the caliber of wines at the dinners (and how little difference there can often be between 1st, 2nd, and 3rd), some variance is not surprising.

I doubt. People have many palates, as many are unique.

Seems pretty consistent with may groups. Especially if you factor in how old the wines he’s tasting are. Note this is comparing one particular taster against the group, which will vary quite a bit, depending on who that individual is. Francois is tasting with many different people, so I think the claim of selection bias is invalid. (The attendees for my groups vary greatly, too.) One of the main points is how many different wines get first place votes. With my groups, with 8 or so wines, it’s beyond typical for 5 or 6 wines to get both first and last place votes. We also see the spread based on the totals (1 point for 1st, two points for 2nd, etc.) so we can see clusters of preferences.

We can see the stats for who correlates best with the group (leading to a joking between people saying they have the best palate and detractors saying, no you have the most average palate, while almost everyone else ignores their boring attempts at humor.)

We have similar palates, but sadly, differing wallets.

I think there would be bias, and there’s no way to avoid it unless you plan a tasting blind, silent, and painfully dull. Even at blind tastings, I’m influenced by someone’s excitement as their special bottle is passed around.

Cheers, and thanks for an inside look into a wine world I’ll never know.

Warren

Just eyeballing it without access to the raw data, I would estimate that the correlation coefficient is r=.7 for the purpose of argument. That implies that 50% of the differences in the ratings are due to objective factors and 50% of the differences are due to subjective factors. Vive les differences!

PS- A whole lot of caveats apply

In my approach towards wine my dinners intend to be gastronomic experiences and not tastings. For me, it is extremely important.

And we do not want to capture the intrinseque value of a wine, but feel an emotion by the combination of a wine and a dish. A great dish will promote a wine if the combination is perfect.

Many times people ask me : “how do you want us to vote, with which criteria ?” and I answer : “the rules are yours, and it is more a vote of pleasure and not a vote for intrinseque value”.

When someone puts a champagne before a liquorous it means that he estimates that he has had more pleasure with the champagne than with the liquorous, but it does not mean that the champagne is a greater wine that the liquorous, because such a relativity has no sense.

In my dinners there is no direct competition. I explain : in a dinner if you have 1959 Haut-Brion and 1961 Haut-Brion, you feel obliged to say which one is better.
If in a dinner I put 1918 Haut-Brion and 1976 haut-Brion you do not have the same obligation as their ranges of tastes are different.

The intellectual process of enjoying wines of different regions and/or ages is very different from the process of enjoying wines of similar regions and similar ages.

Many people organize verticals / horizontals where the wines are ranked in order to say which wines are the best. I organize gastronomic experiences in which when a wine is declared the winner, it is not the wine which is the best but the moment.

In this respect the computation that I made wants just to show the variability of tastes even if there are tendancies, and does not want to give sometimes which could be engraved in marble.